I’m trying to export a png of a scene (works fine when using GUI). I create a pvpython script using ‘start trace’, ‘stop trace’ and the color legend is all messed up upon export to png.
I’ve fixed the Scalarbar position/location/etc by poking around with pdb. I was unable to find how to change the tick length, which for some reason is being rendered super long (not the case with GUI). Haven’t found anything helpful in the pvpython docs.
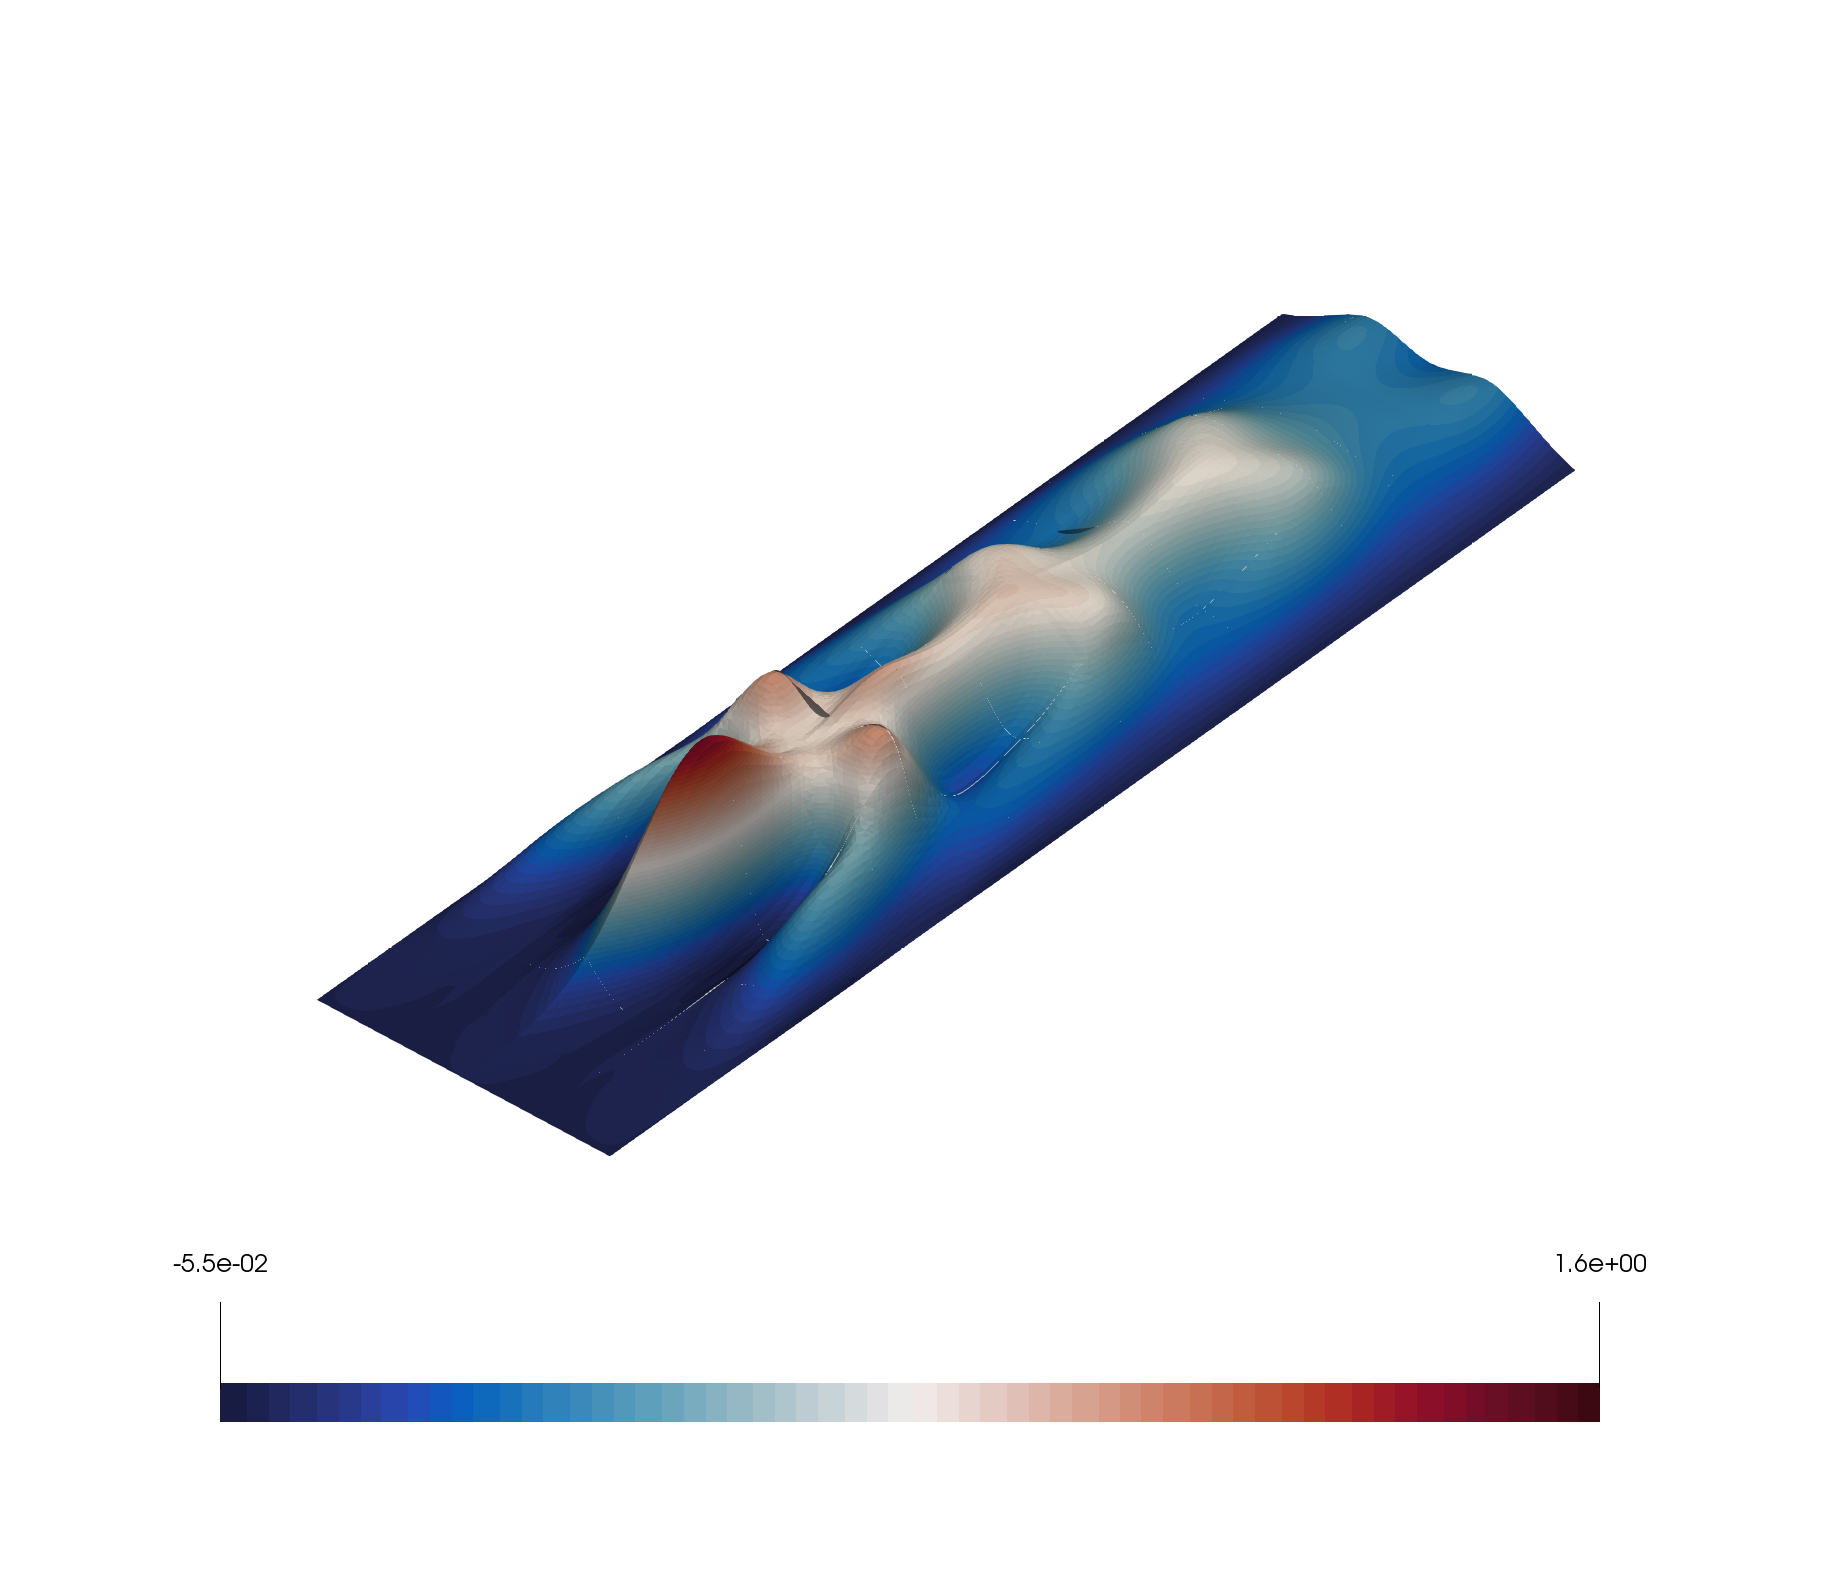
As you can see, the ticks are way too long and look terrible. Even if I don’t draw them by setting ‘scalarbar.DrawTickMarks = 0’, the labels just float too far away from the colorbar.
I’m finding this very frustrating – if I can’t programatically generate reasonable looking color bars, I can’t use Paraview at all.
To be specific, the issue is the long black lines leading to the numbers (-5.5e-02 for example). I assume these black lines are ‘ticks’.
I don’t believe the issue is related to the white background (I had the same issues with the standard background). However, I need to generate plots on a white background, so even if it worked on the standard background, I couldn’t use that as a fix.
If I had to guess what’s happening, the pvpython script seems to be tacitly rescaling the color legend so that it’s huge. I am manually resetting the location, length, and thickness later in the script, but the enormous ticks stay the same since I can’t seem to modify them directly through the ScalarBar object.
I imagine there must be some way to control tick size using the pvpython API… But the ScalarBar attributes seem to only contain a flag which draws them or doesn’t (nothing to control their size).
I’d be happy to include the entire pvpython script, it’s just unwieldy so I omitted it in case there’s a simple API call I’m missing.
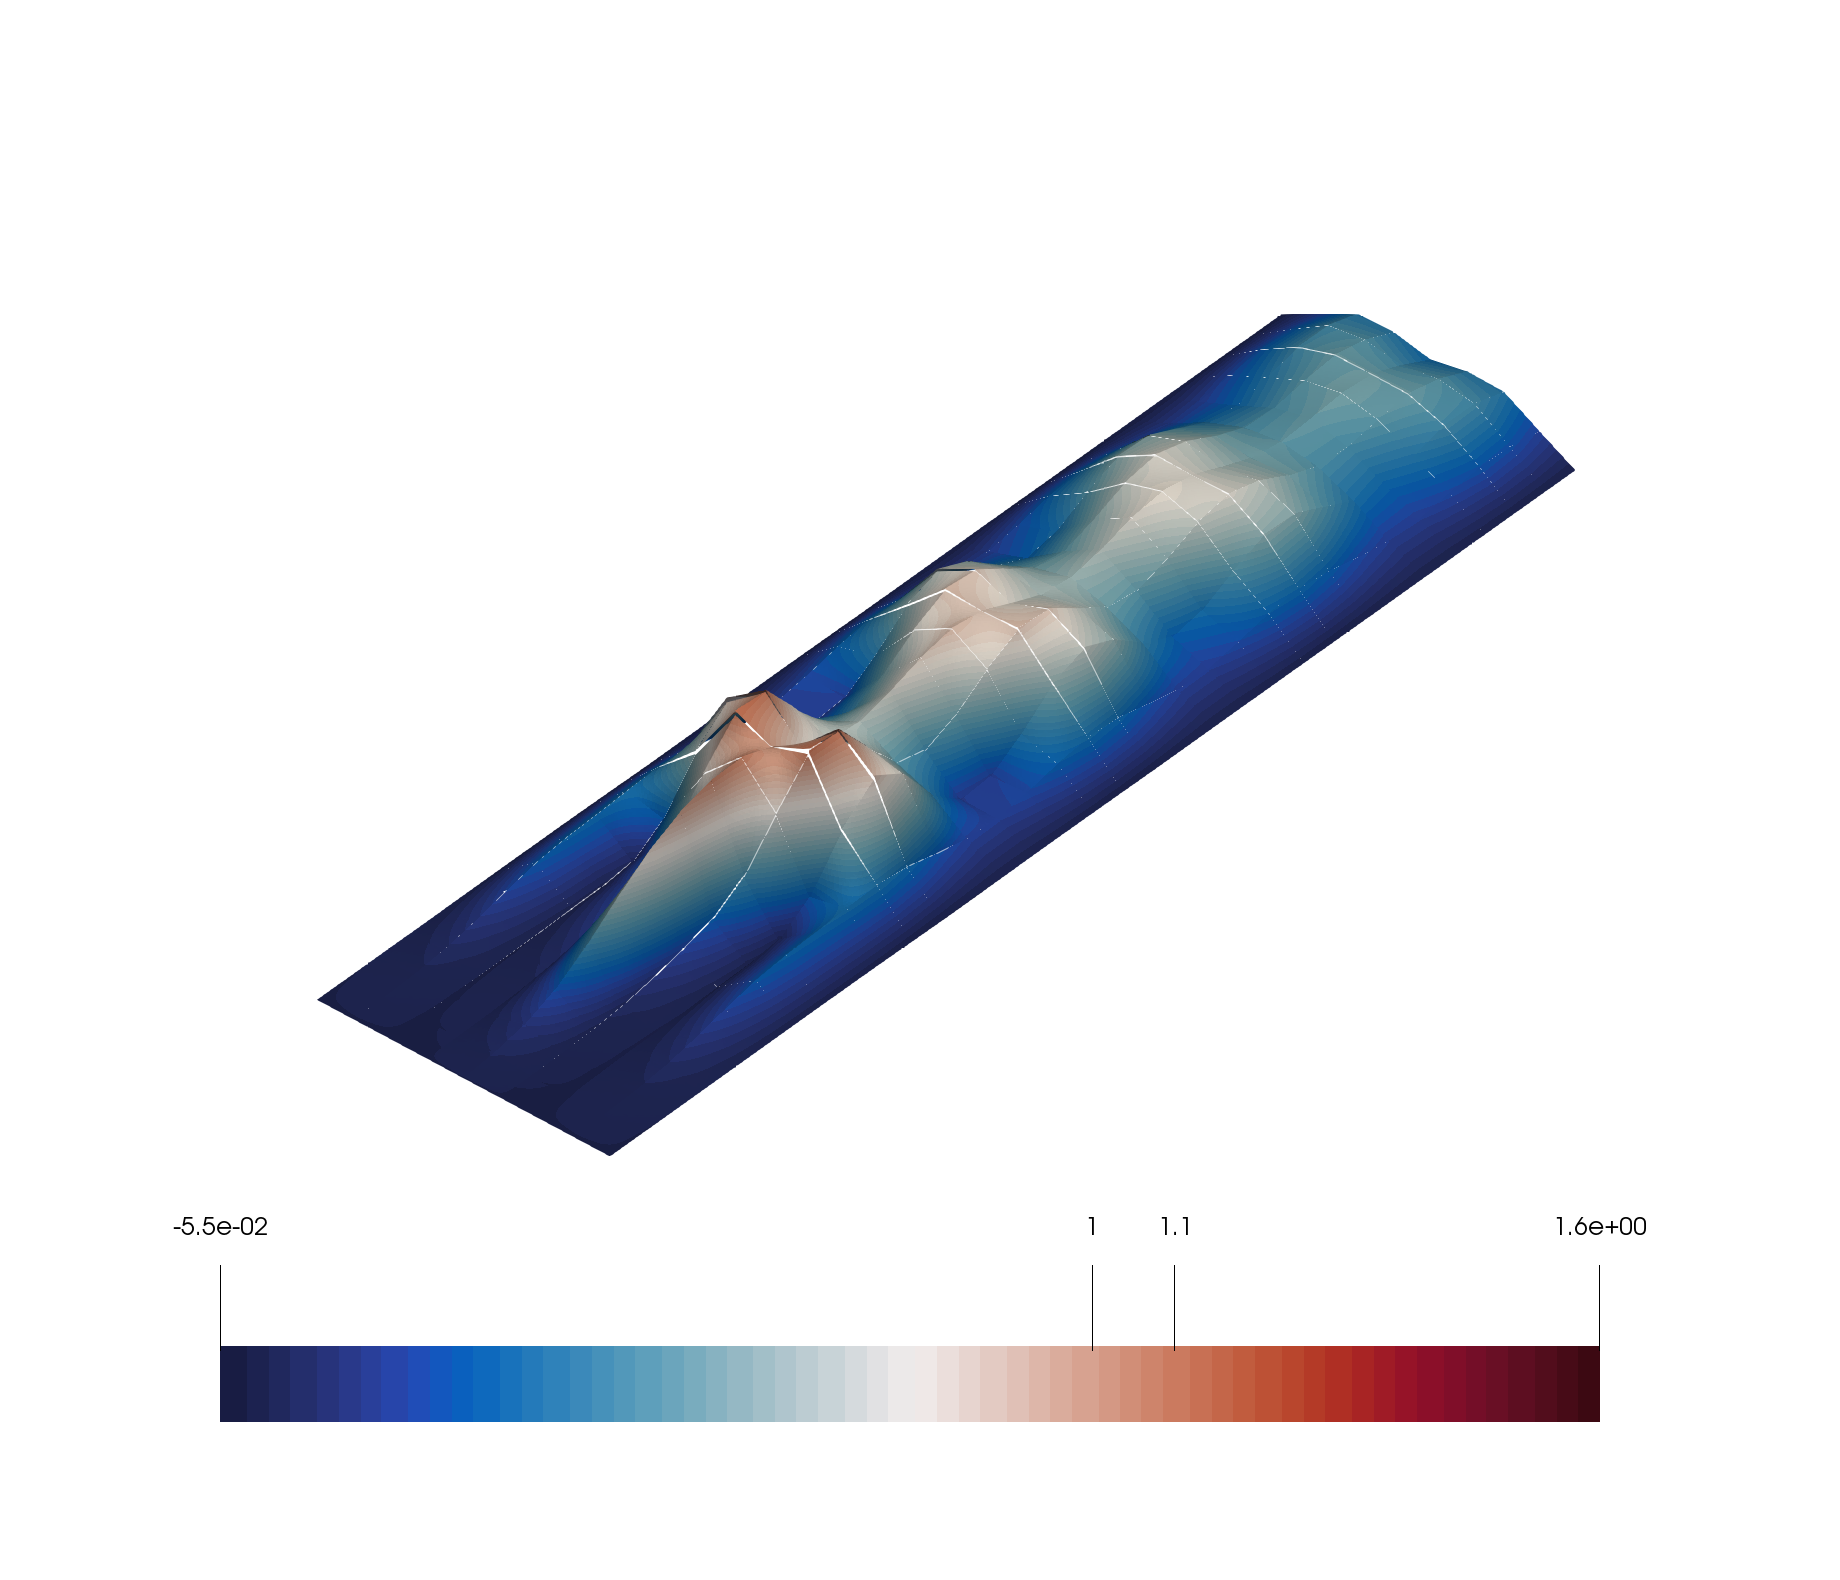
@CorbinFoucart This may not yield anything fruitful, but as a quick test could you try to increase or decrease the number of levels or ticks in the legend? and check the result.
Since it seems there isn’t an easy answer, here’s the pvpython script. I’m using Paraview 5.4.0-RC3. I was going to put it in the comment, but I’m abutting the character limit.
There is no public API to specify the tick length in ParaView. It is set to 75% of the label text height in ParaView 5.6.0. That appears not to be working in ParaView 5.4.0-RC3.
My advice would be to try ParaView 5.6.0 as the sizing issues between text tick length may be fixed in that version.
Hello, I am having the exact same problem with Paraview 5.7 (all is fine if using the GUI). Is there a way to fix this? When the colobar is in the vertical position at the right edge of the image, the tick marks are so long that I loose the tick mark labels and title.