Thanks guys,
You are right @Kenneth_Moreland the discussion has moved from the original topic, I think that I was searching for something similar to this an original post by @graysuit. @Rodrigo_Rocha asked the same here
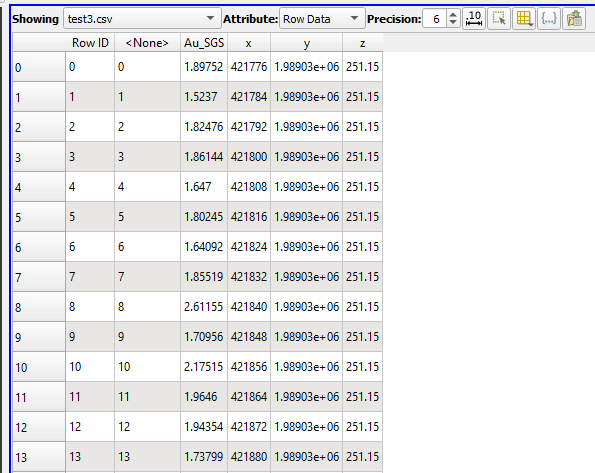
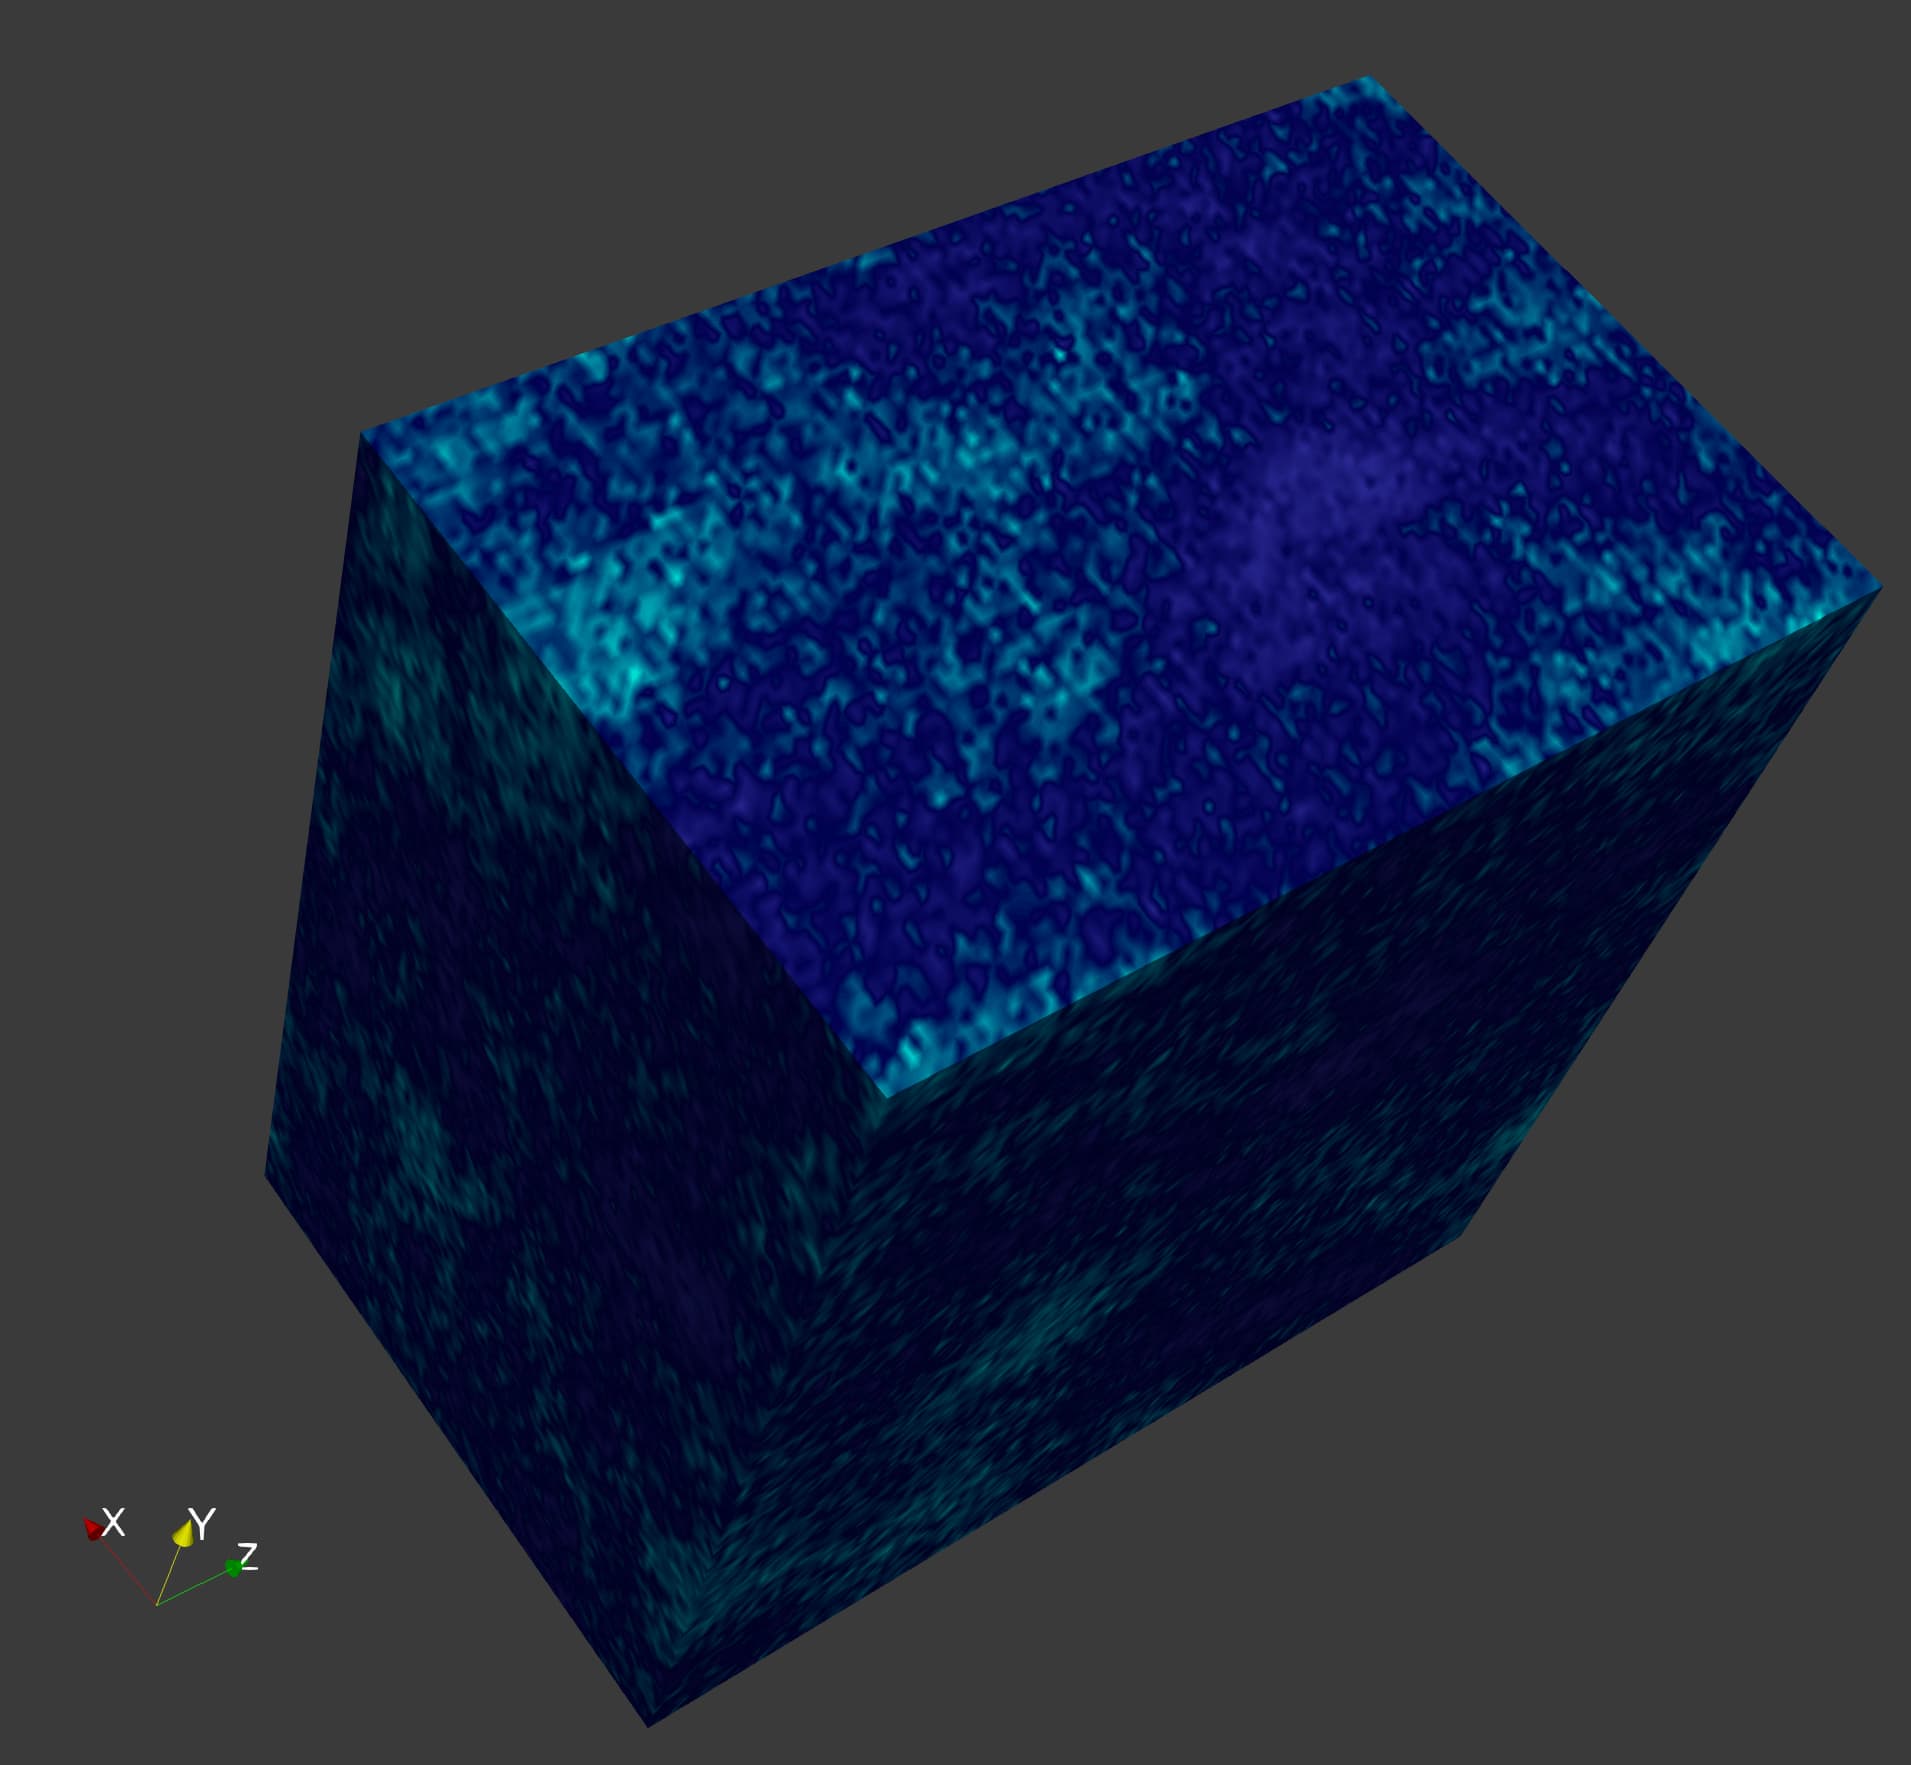
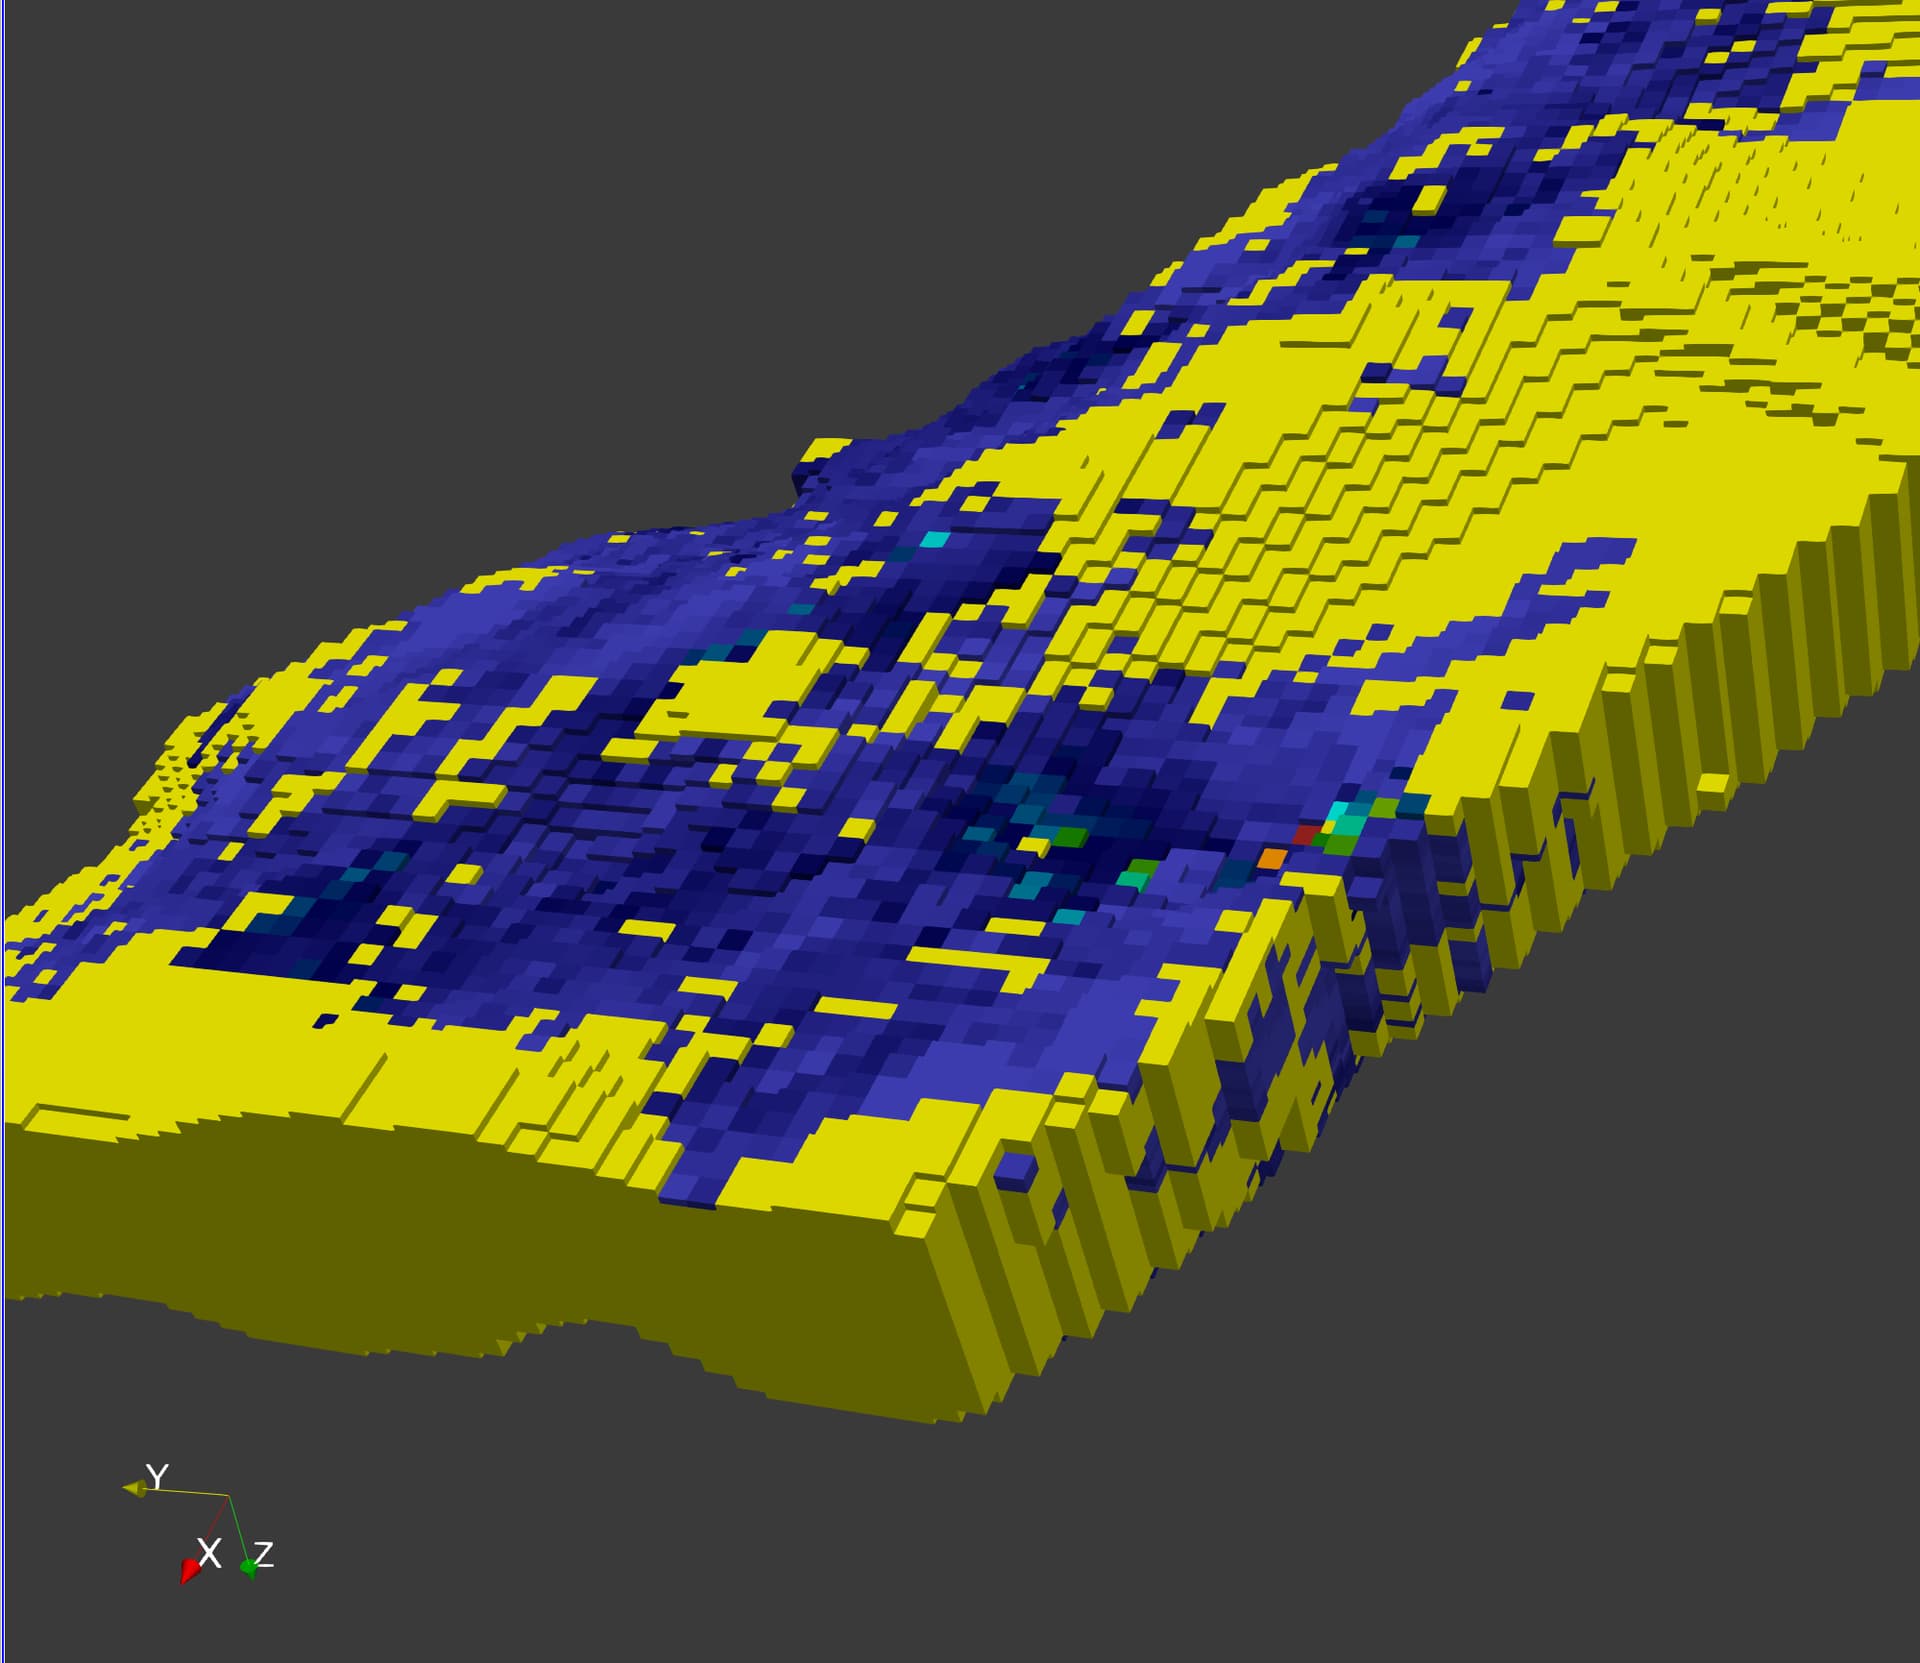
My dataset is a geological block model: a table where every row represents a point with xyz location and a set of variables like gold, silver, copper, density, name of the rock, etc (only Au_SGS included here)
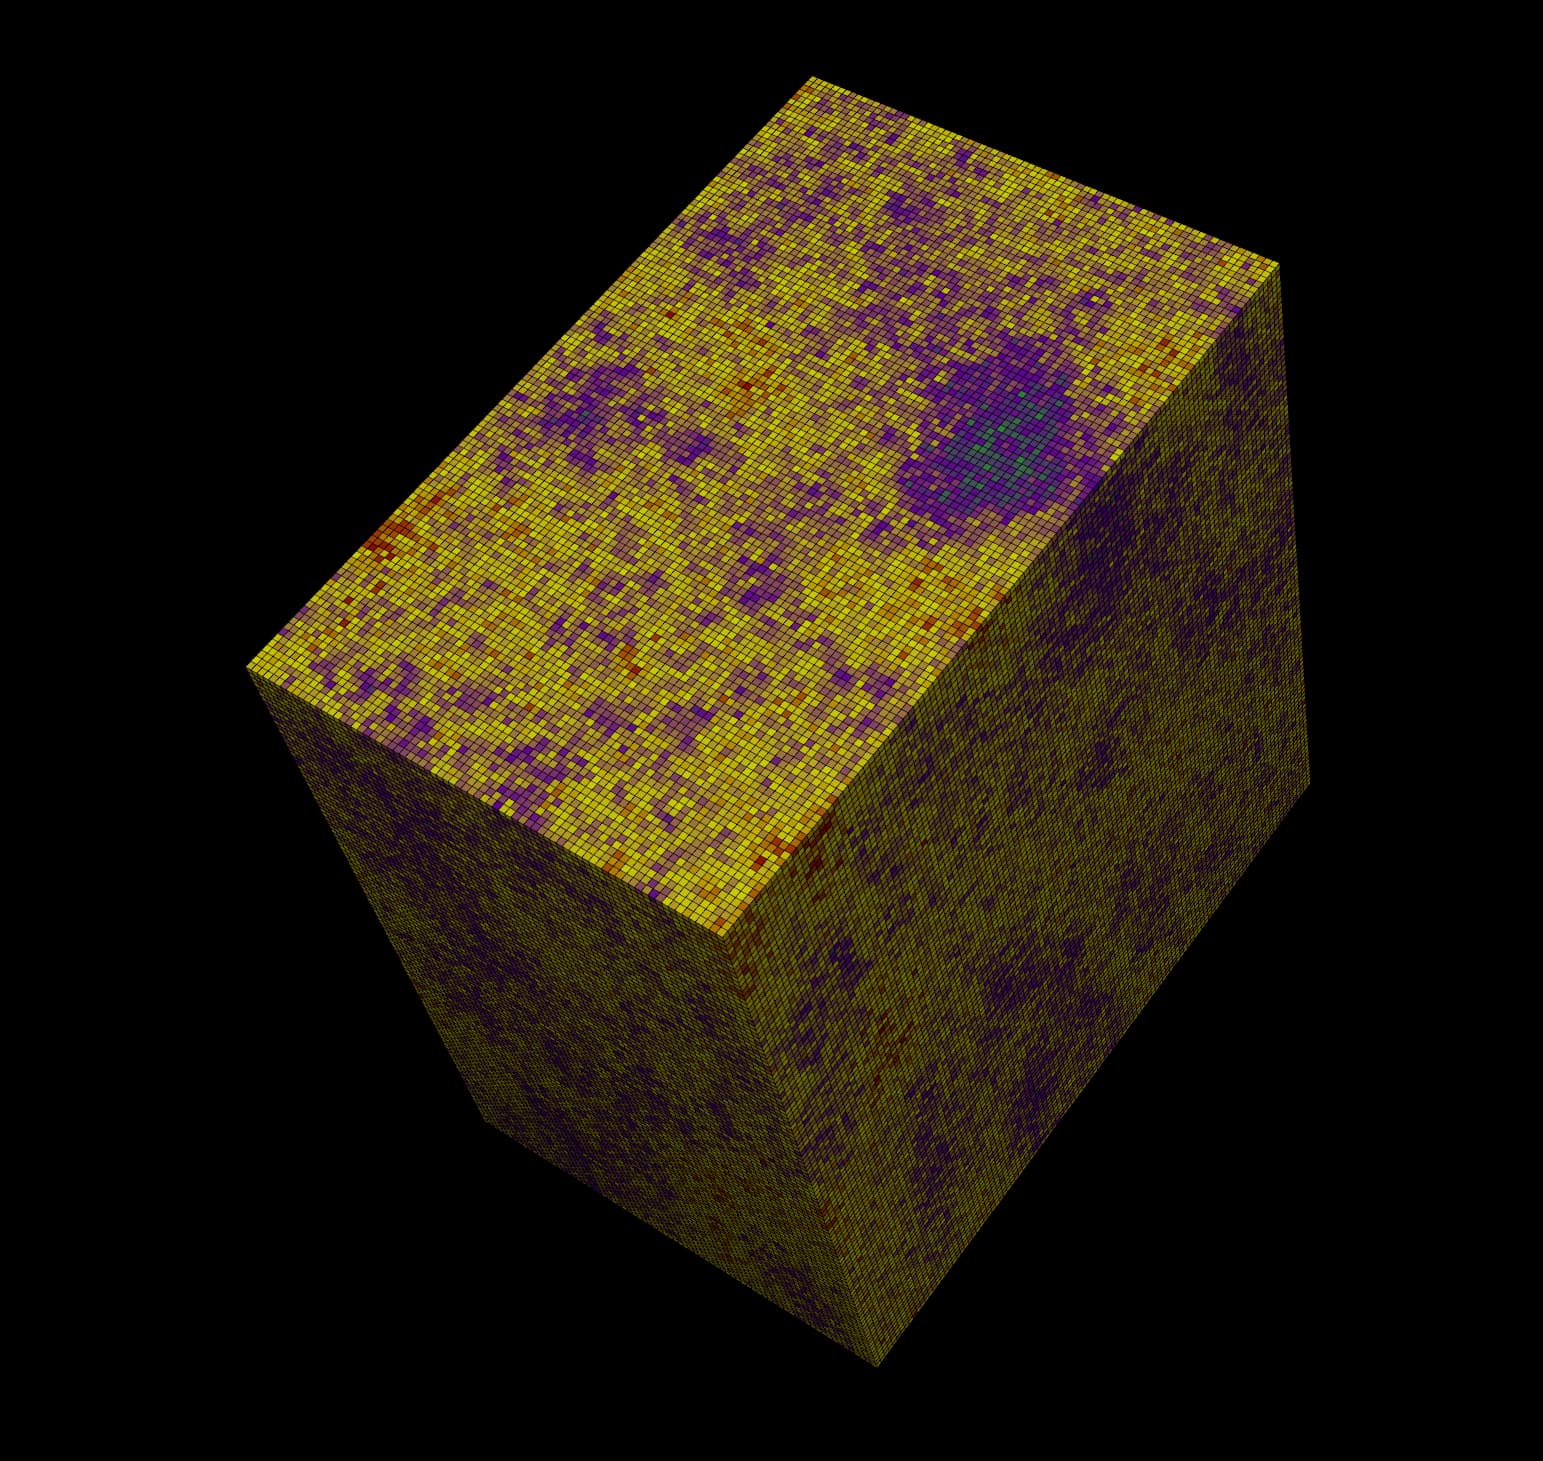
The goal is to represent these points like cubes where every cube can take a different color based upon its variable value
Then separate some cubes based upon a range of variable values (eg: Au SGS>4)
I thought that the point data to cell data filter will work but I did not know that paraview uses the point like a grid vertex, my best approach for now is this:
To use the table to structured grid filter
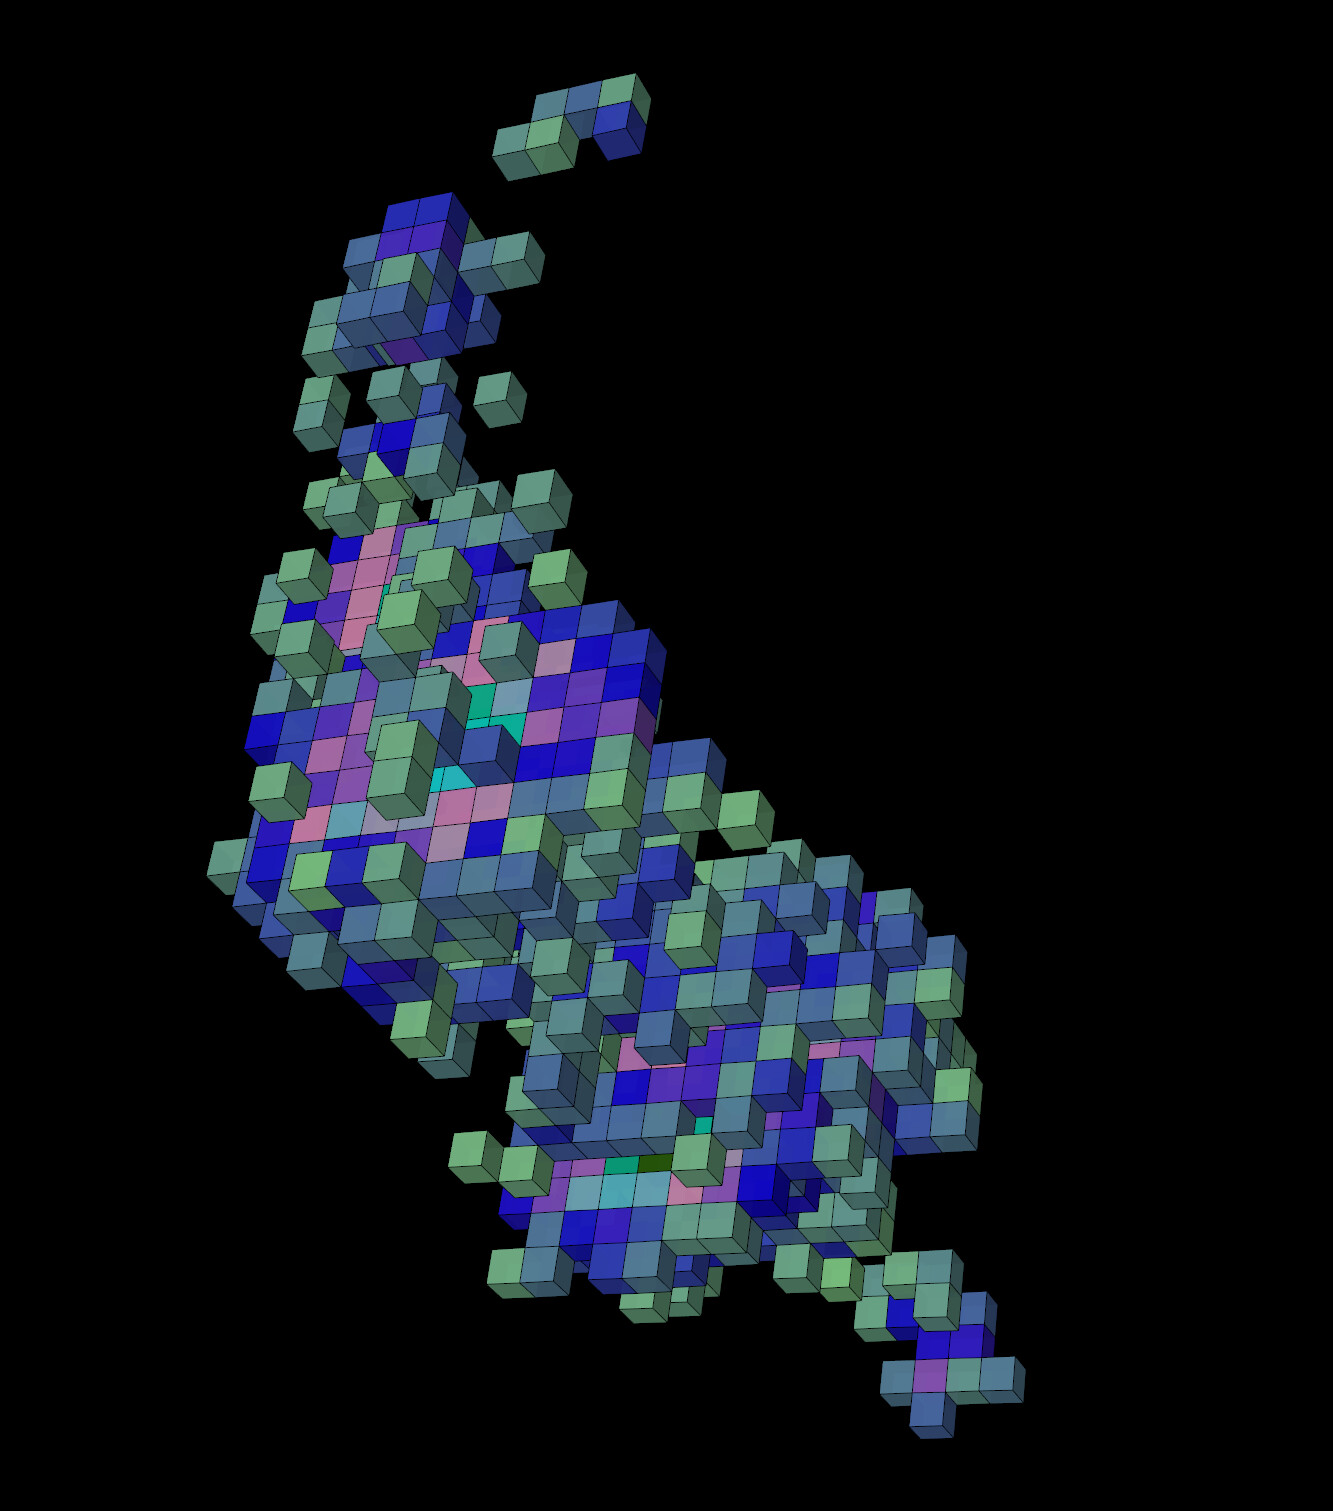
Threshold filter based upon a variable range (here Au_SGS > 4)
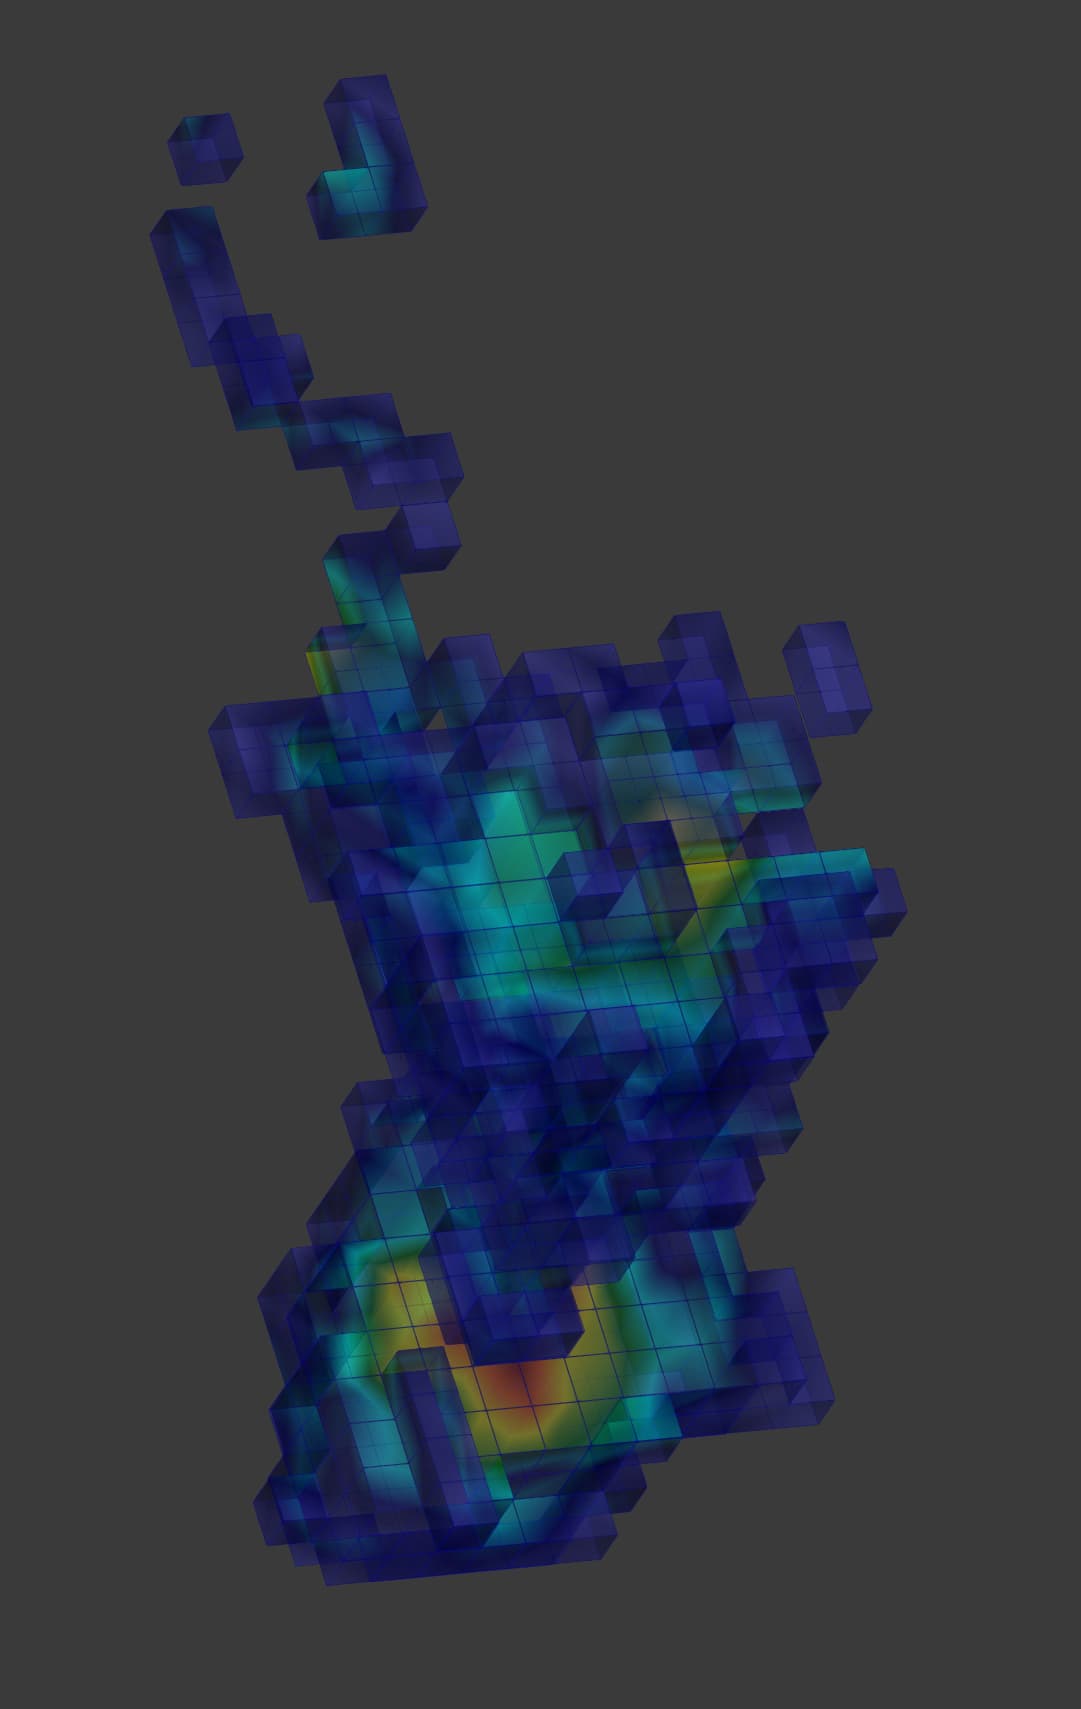
Cell Center Filter to get the centroid of the cubes
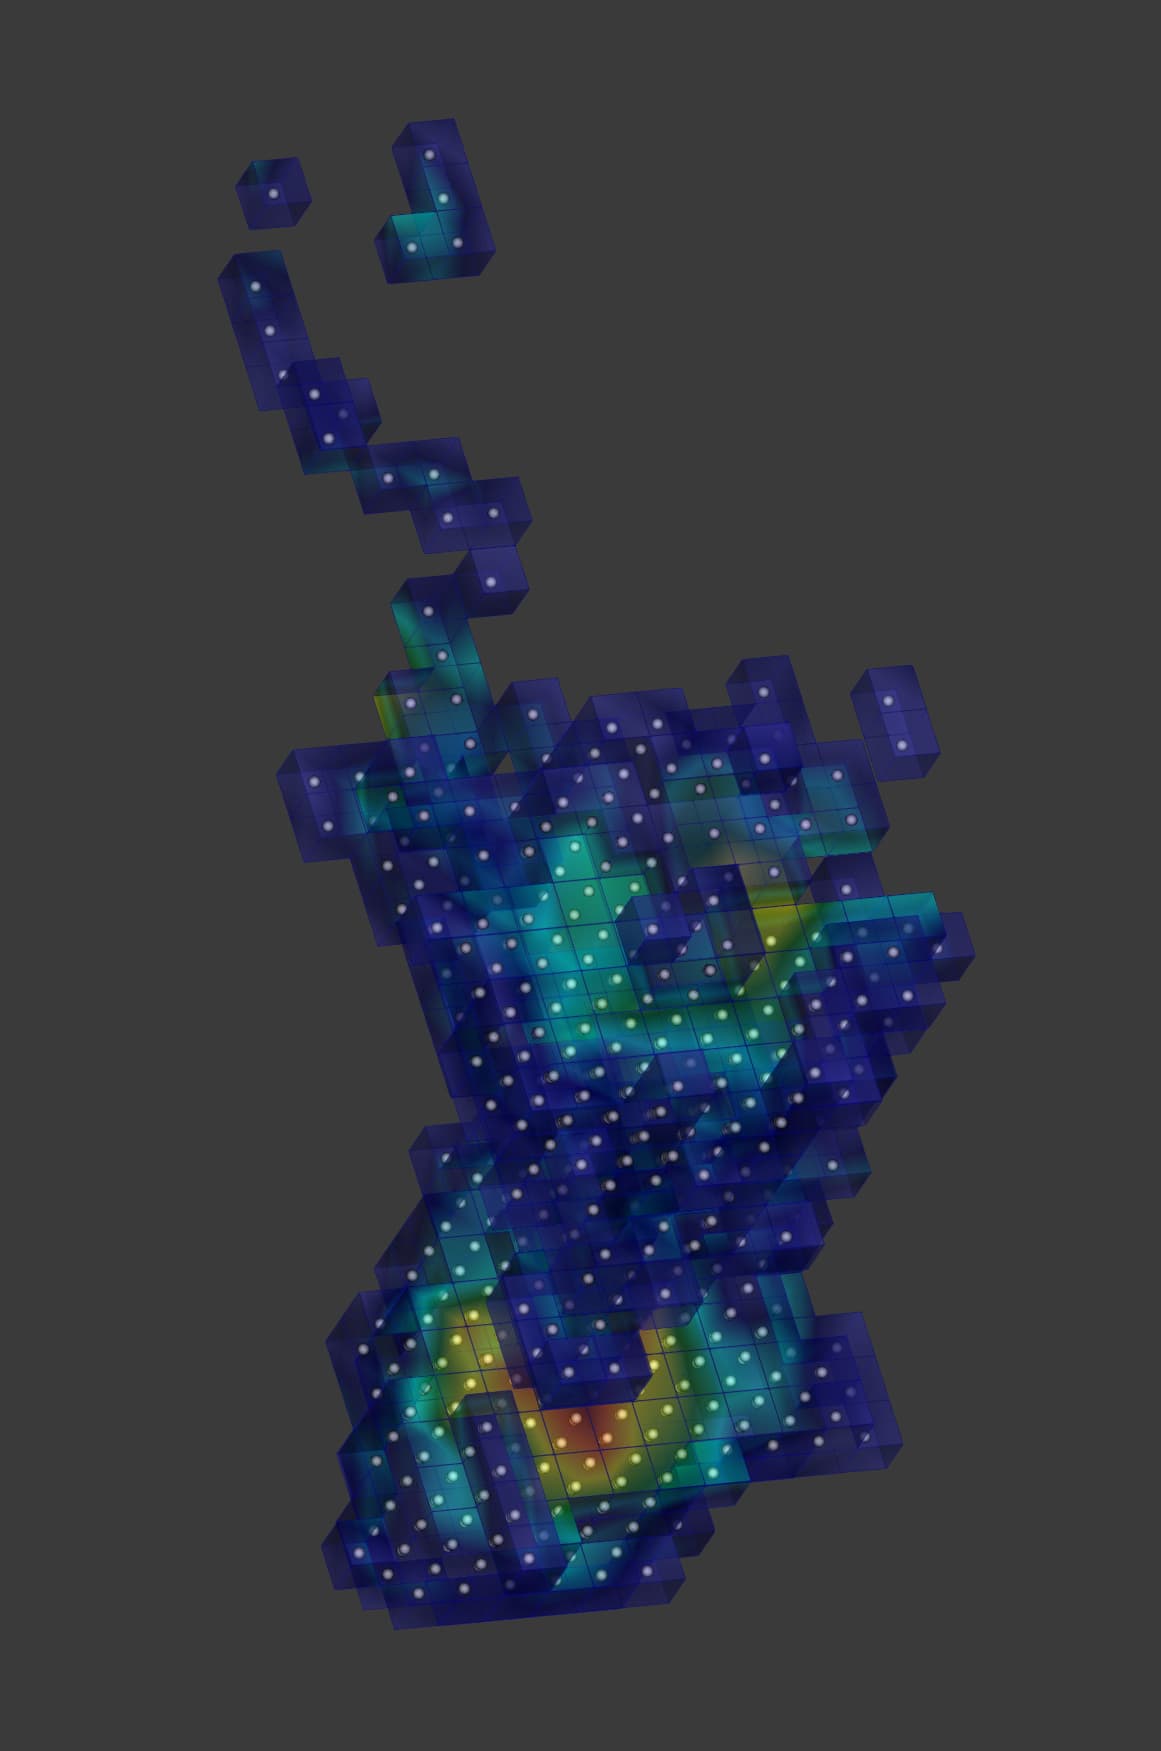
Resample with datase filter to assign the cubes values to the centroid points
Point data to cell data filter to assign the centroid point value to the cube and get a unique color by cube

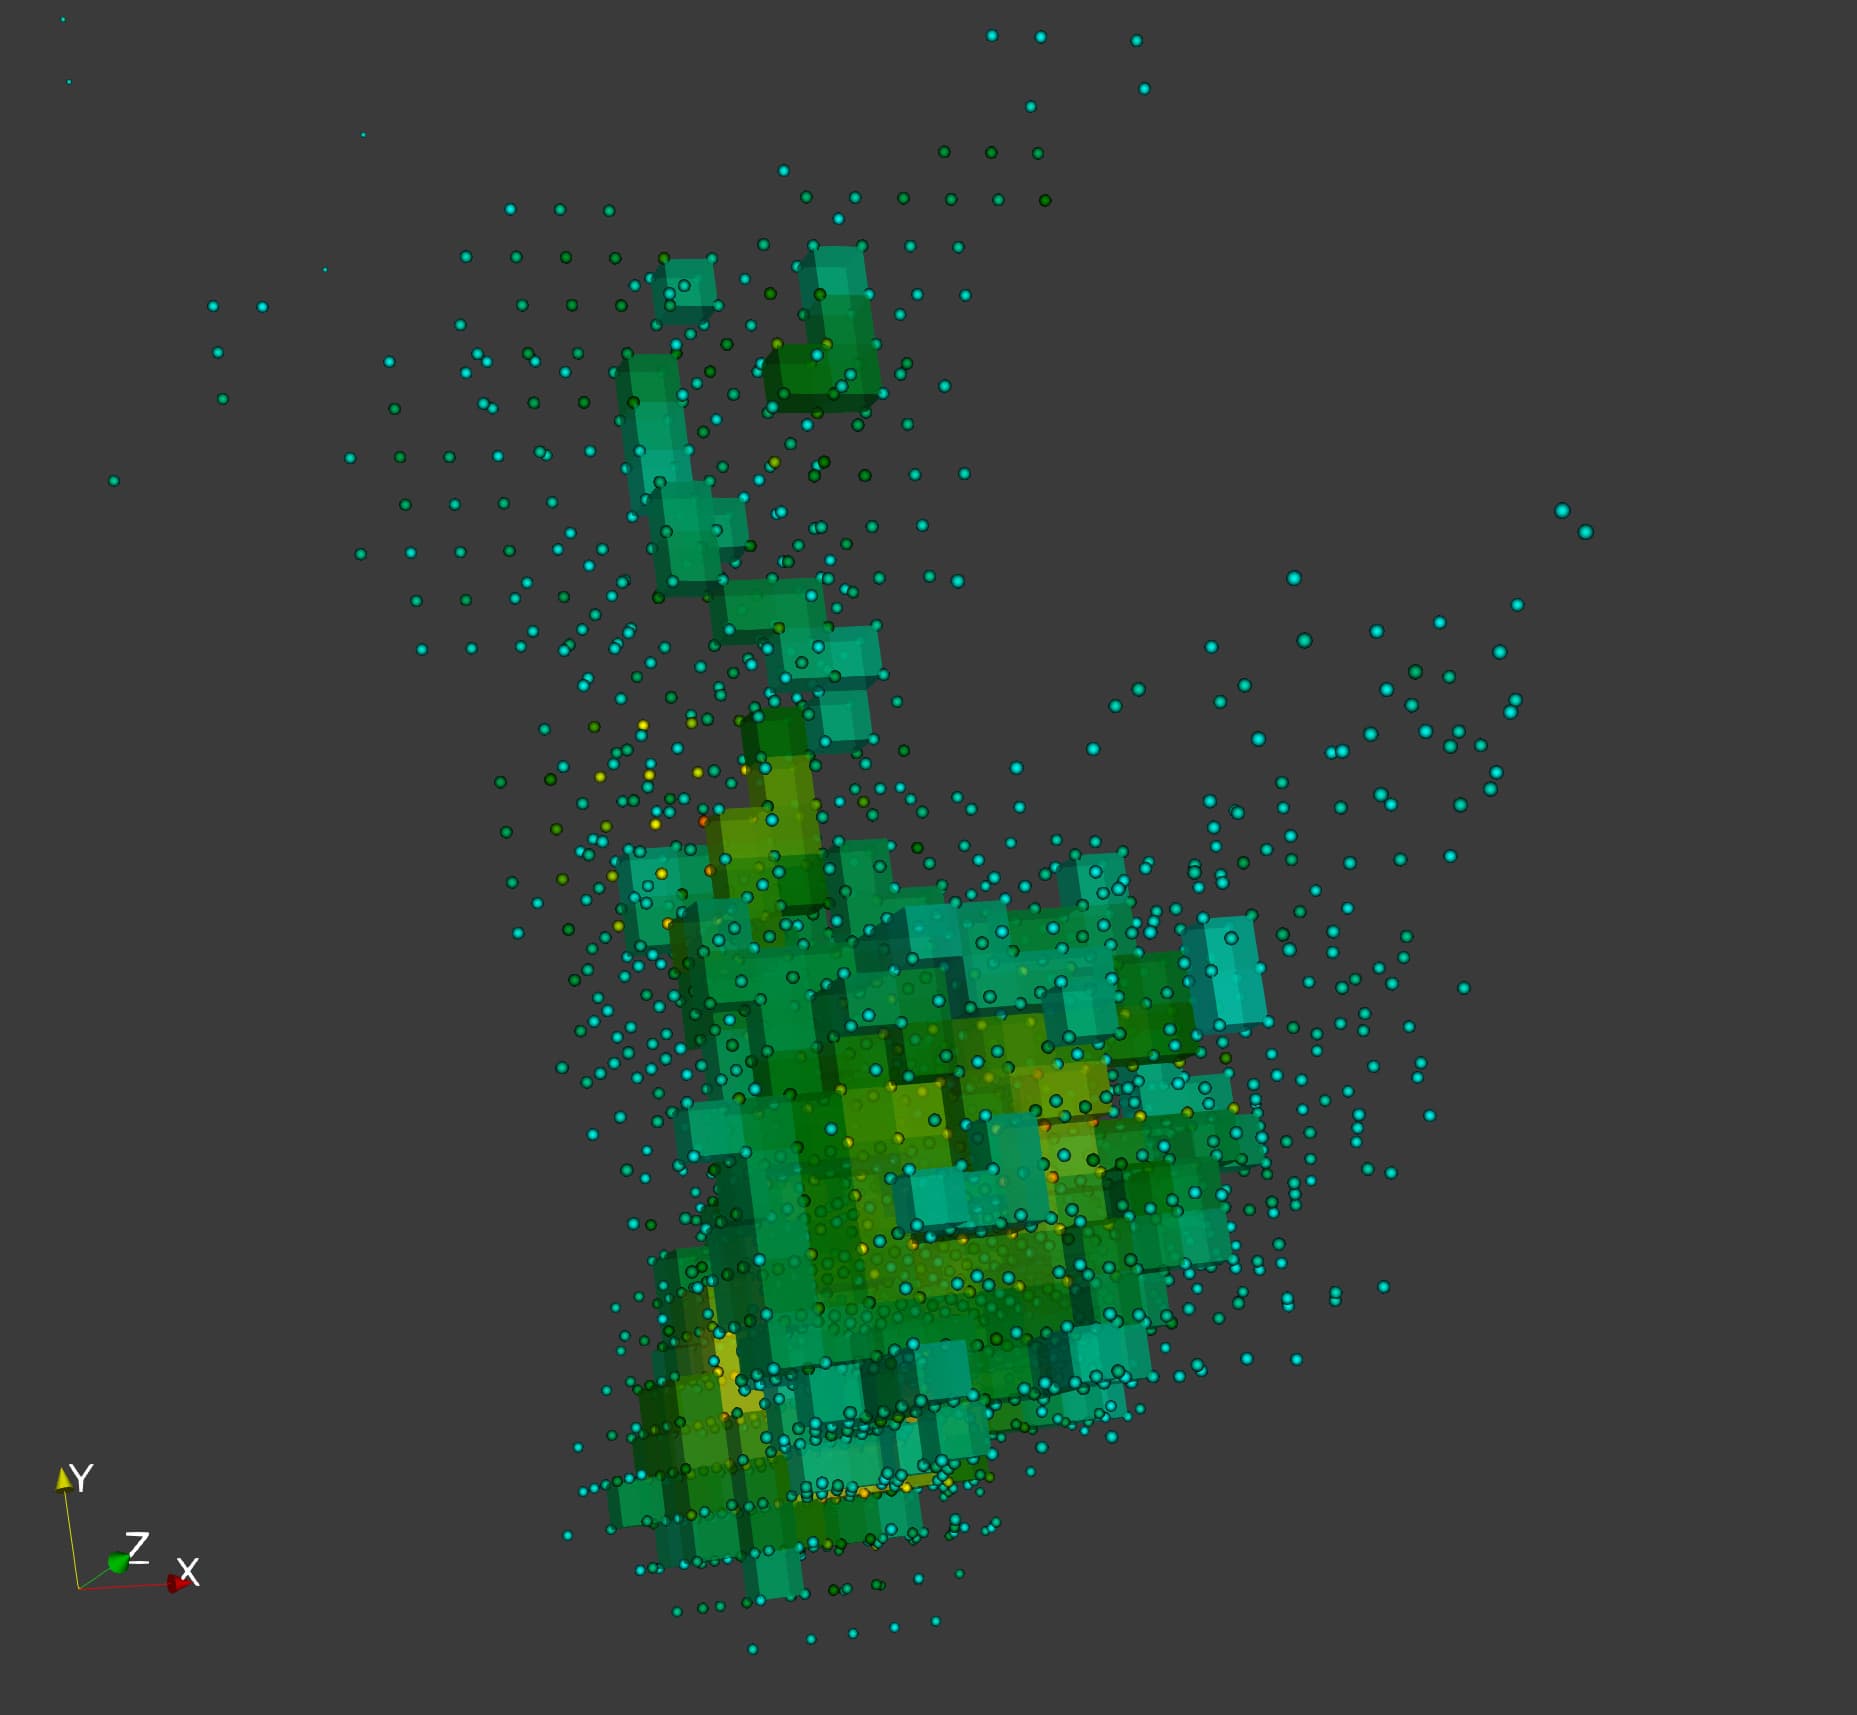
It looks nice and very similar graphically to what I expected, like the block.vtu example of @graysuit
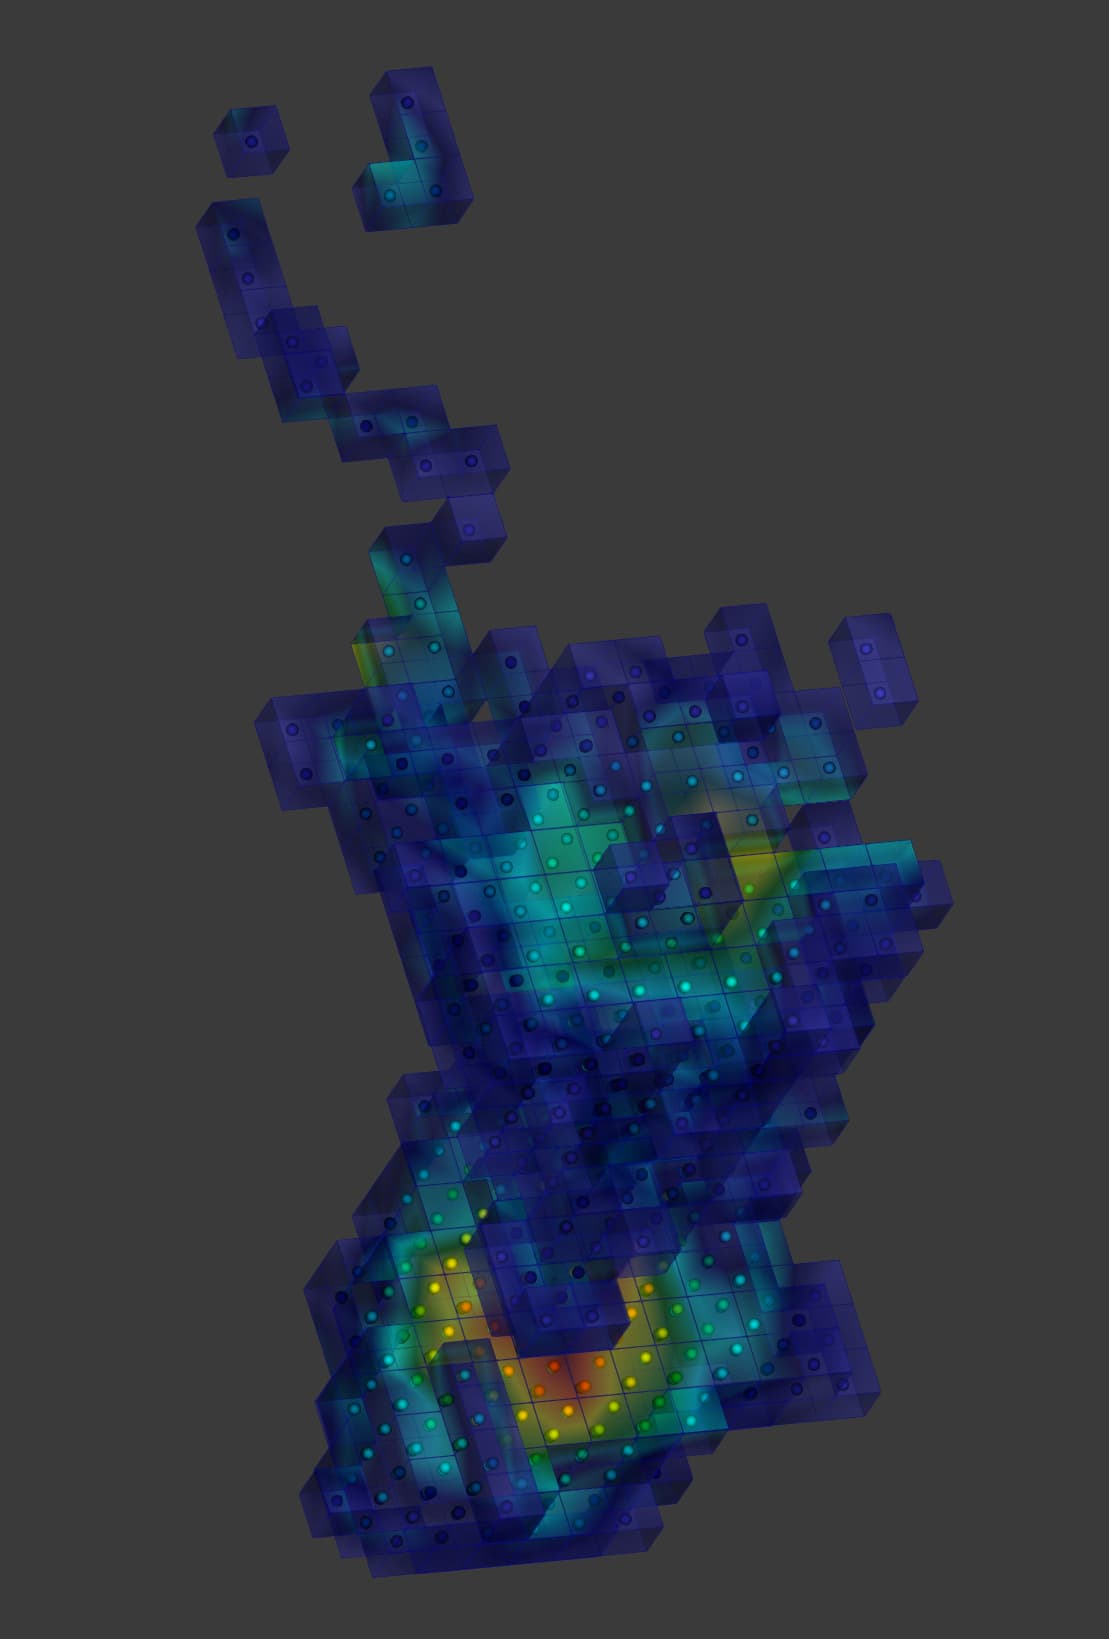
However if I use the original points and apply an extraction selection filter to Au_SGS > 4 and compare them with the cubes they do not match