Hello, I am using paraview to compare two different point clouds of roughly the same geometry.
One cloud is more point dense and each point’s magnitude represents strain. The other cloud is more sparse and each point is a cell center where the magnitude represents the average 3 nearest neighbors value.
Essentially, I am trying to correlate strain and cell density. The easiest way for me to do this, would be to just select regions, average the strain, average the avg 3 nearest neighbors, then plot each in a bar plot. However, I am wondering if anyone has any ideas on how to do this differently and perhaps creating some kind of a contour map of “correlation” between these two measures.
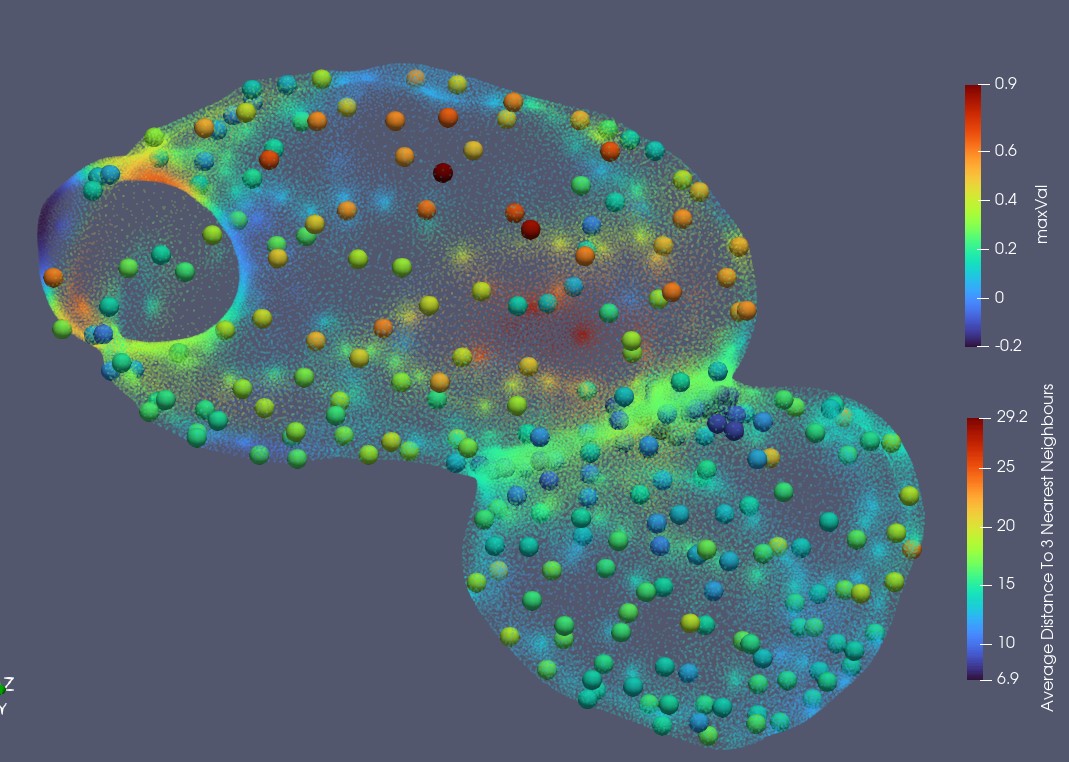
I’ve attached a sample image here, where the large spheres are cell centers/3 nearest neighbor magnitude, and the small points are strain.
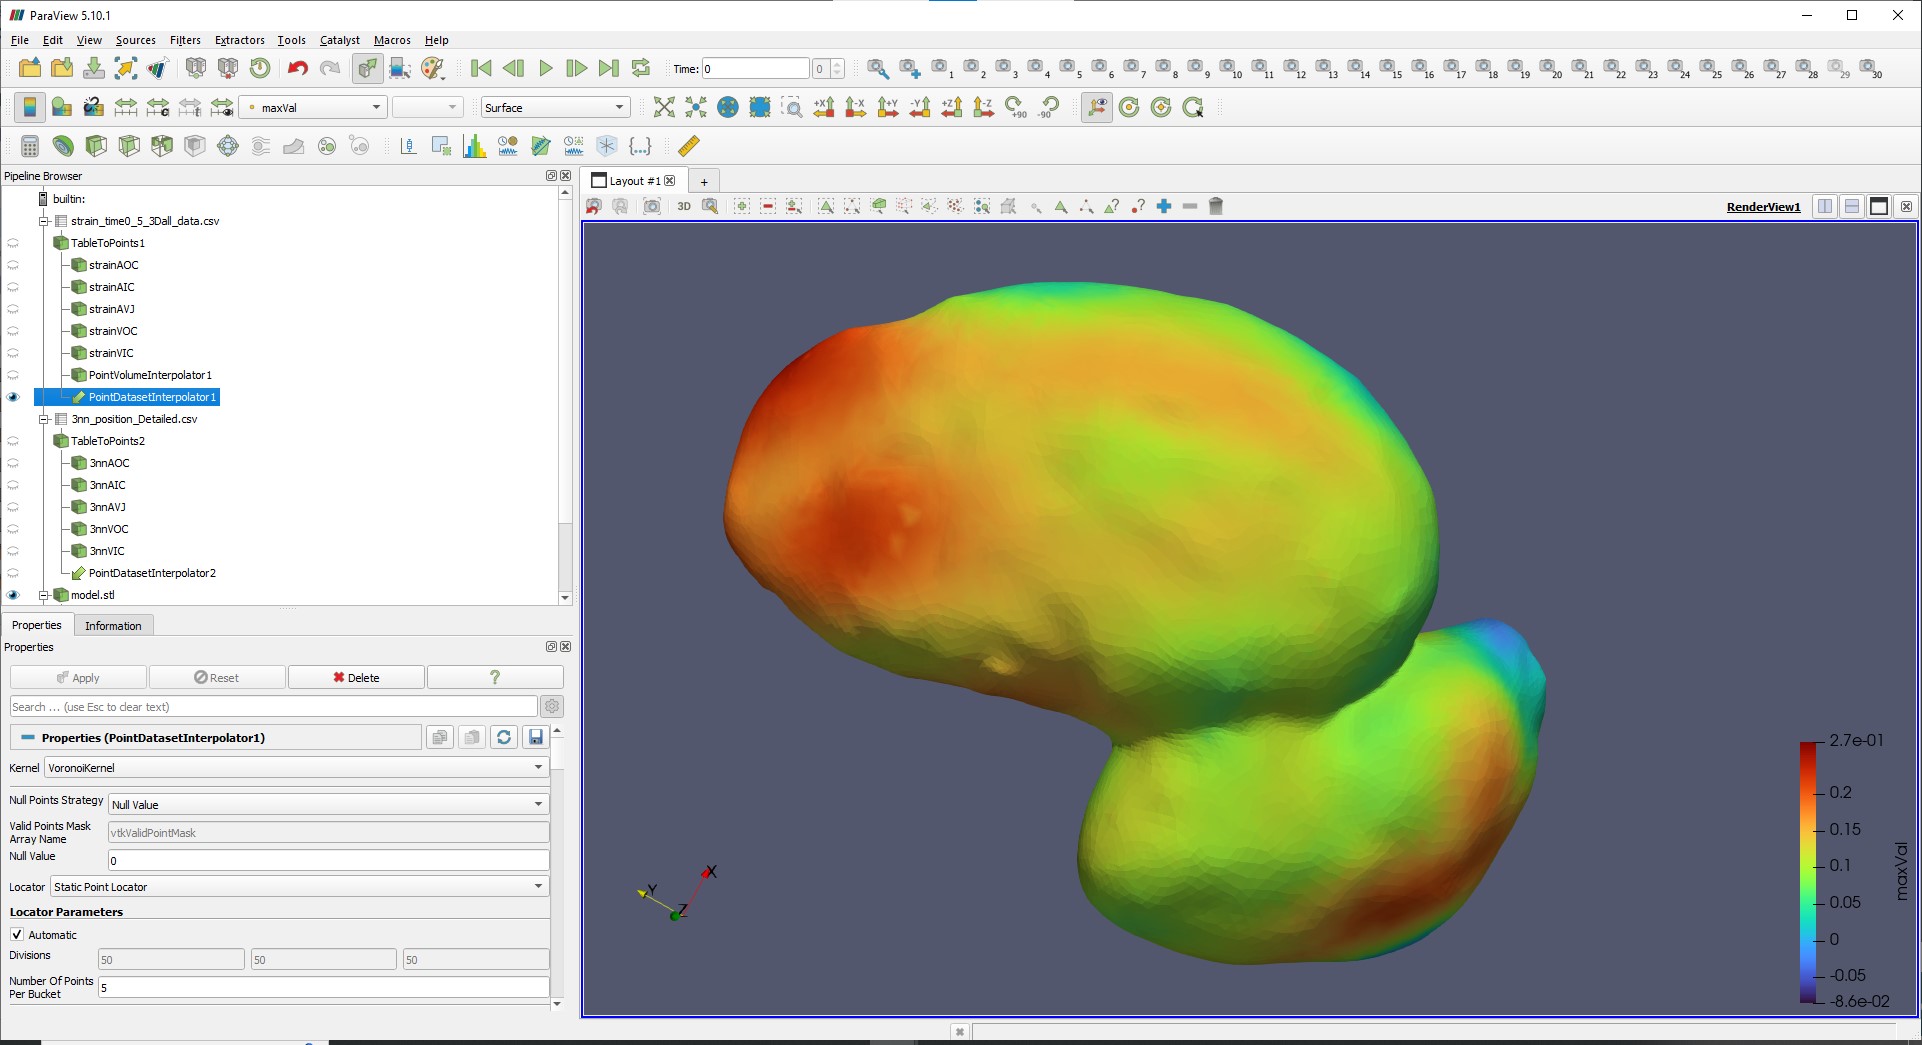
This might not be the best solution, but probably the easiest thing is to start by applying the Point Volume Interpolator on the more dense cloud. Make sure the resolution is sufficient to capture the detail of the points.
Next, apply Resample with Dataset with the Source Data Arrays input set to the point volume interpolator and the Destination Mesh input set to your sparse data set. Also turn on the Pass Cell Arrays and Pass Point Arrays options (advanced properties). This will give you a data set containing your sparse cloud containing fields from both that can be directly compared.
“strain_time0_9_3Dall_data.csv”
This is the dense point cloud.
Relevant columns: X, Y, Z, and maxVal (strain, which is the data I want to collect in the vicinity of the sparse points).
“translated_position_3nn.csv”
This is the sparse point cloud, each point’s location corresponds to the location in the dense point cloud that I want to gather strain data from. The strain data will be compared to “Average Distance To 3 Nearest Neighbours”
Relevant columns: Position X, Position Y, Z translated, and “Average Distance To 3 Nearest Neighbours”
Please let me know if you would prefer another format or if I should simplify the tables. This is basically my raw data.
I should also mention that I do have an .stl that is the same geometry as both point clouds. I thought that I might be able to interpolate both point clouds onto this .stl (using point dataset interpolator) then just extract my data and compare but haven’t been able to interpolate the sparse data set.