Problem I run into is that my calculator either provides the xyz-coordinates (on selecting point data) or the elevation (on selecting cell data). Never the two datatypes together, unlike the examples. I have converted the file to vtk (in Paraview), tried another reader (in an old version of Paraview).
Making a 3d topography does work with a vtp file of ETOPO provided by earthmodels, but that is not the data I need. I couldn’t find information on how to convert NetCDF to the right vtp format.
There’s a filter “Cell Data to Point Data” that would allow you to convert between the data types. Placing that between your source file and the calculator would allow you to access all fields (or a selected subset) as point data.
The embossing representations featured by Mathieu might be the faster solution for your problem, though.
@thomasvanderlinden : hi - another possible way to go is downloading global high resolution topo/bathymetric data from gebco (15 arc-second):
Data come in (very conveniently) lat/long and you have elevation in meters. The netcdf file you will download download, in its metadata description, contains all the info and details about measurements and references adopted when creating the dataset.
You can also use a specialized color-map to color land and ocean (asymeetric, diverging).
And also, you can download the high definition coastline to overlap to your topo/bathy data. I am sure you might find this link interesting:
@_Marco
Hi Marco, I’m trying to upload elevation into Paraview. I’ve downloaded the data from gebco and was able to open the netcdf file on Paraview but it appears as a 2D map. is there an easy way see the elevation? Somehow converting each cell to the elevation within Paraview?
I really appreciate your help as I’m super stuck.
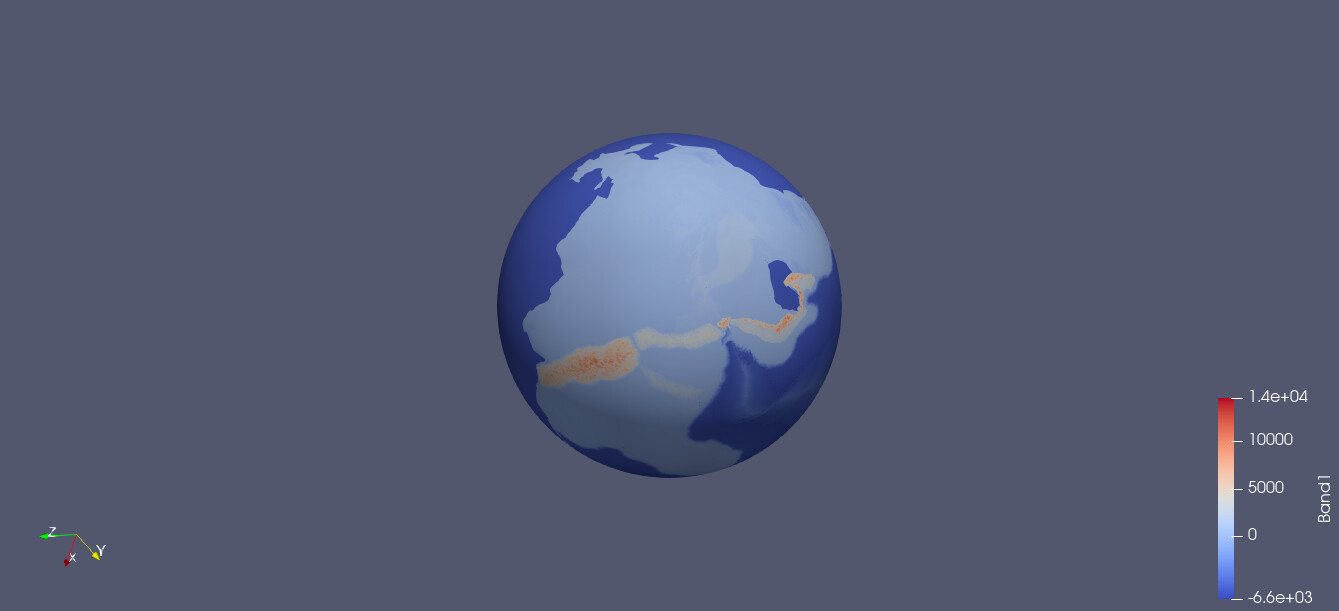
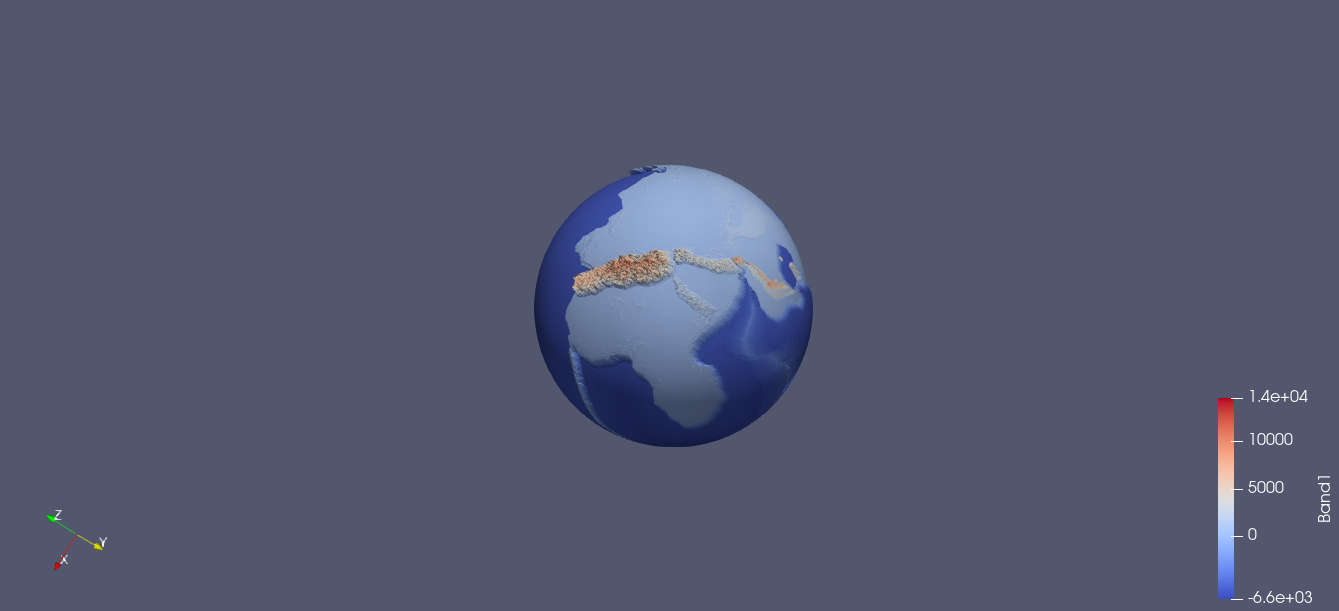
There is a very convenient filter called wrap as scalar. That takes the elevation contained in gebco netcdf and uses that as vertical coordinate.
I can’t remember if it works with both sperical and planar coordinates, you’ll have to try yourself. But I’m sure it works with planar.
You can control the z scaling factor to exaggerate the vertical extrusion. Play a bit around with it. Also, once happy with vertical scaling, apply the right colormap: I suggest diverging asymmetric blue/green/brown. I’m sure you’ll be impressed by the result.
If you want a quick preview, you can see it here. I have used that to overlap my model data to high res topography and posted it on kitware blog.
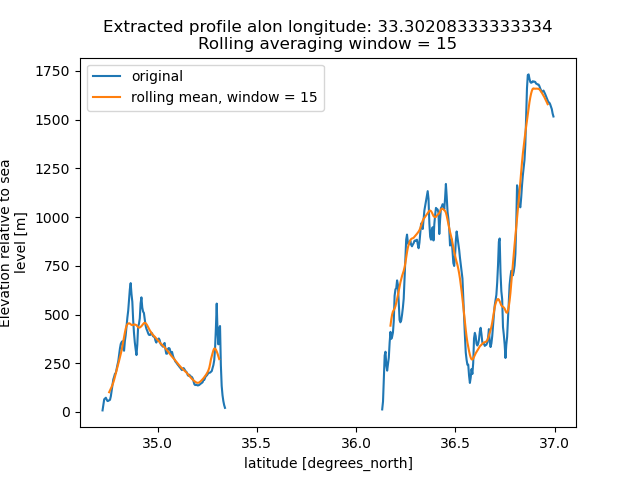
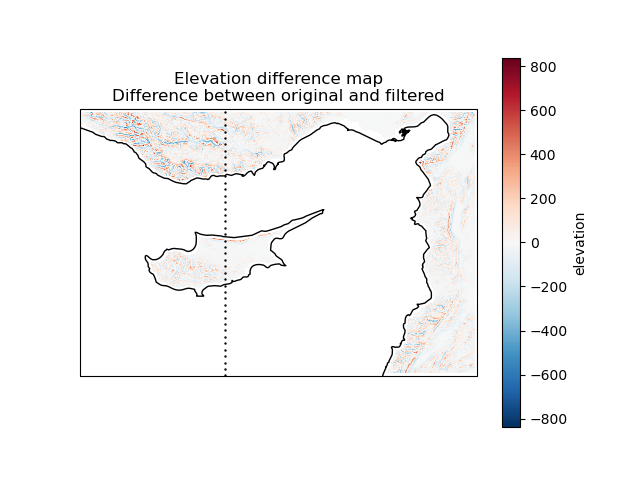
I do that in Python, using xarray. I am using rolling average filtering, along either dimension.
By modulating the window width, I can get the results I want and most like.