Hi,
I did a flow simulation in a pipeline network and I would like to be able to present the results is a really understable way.
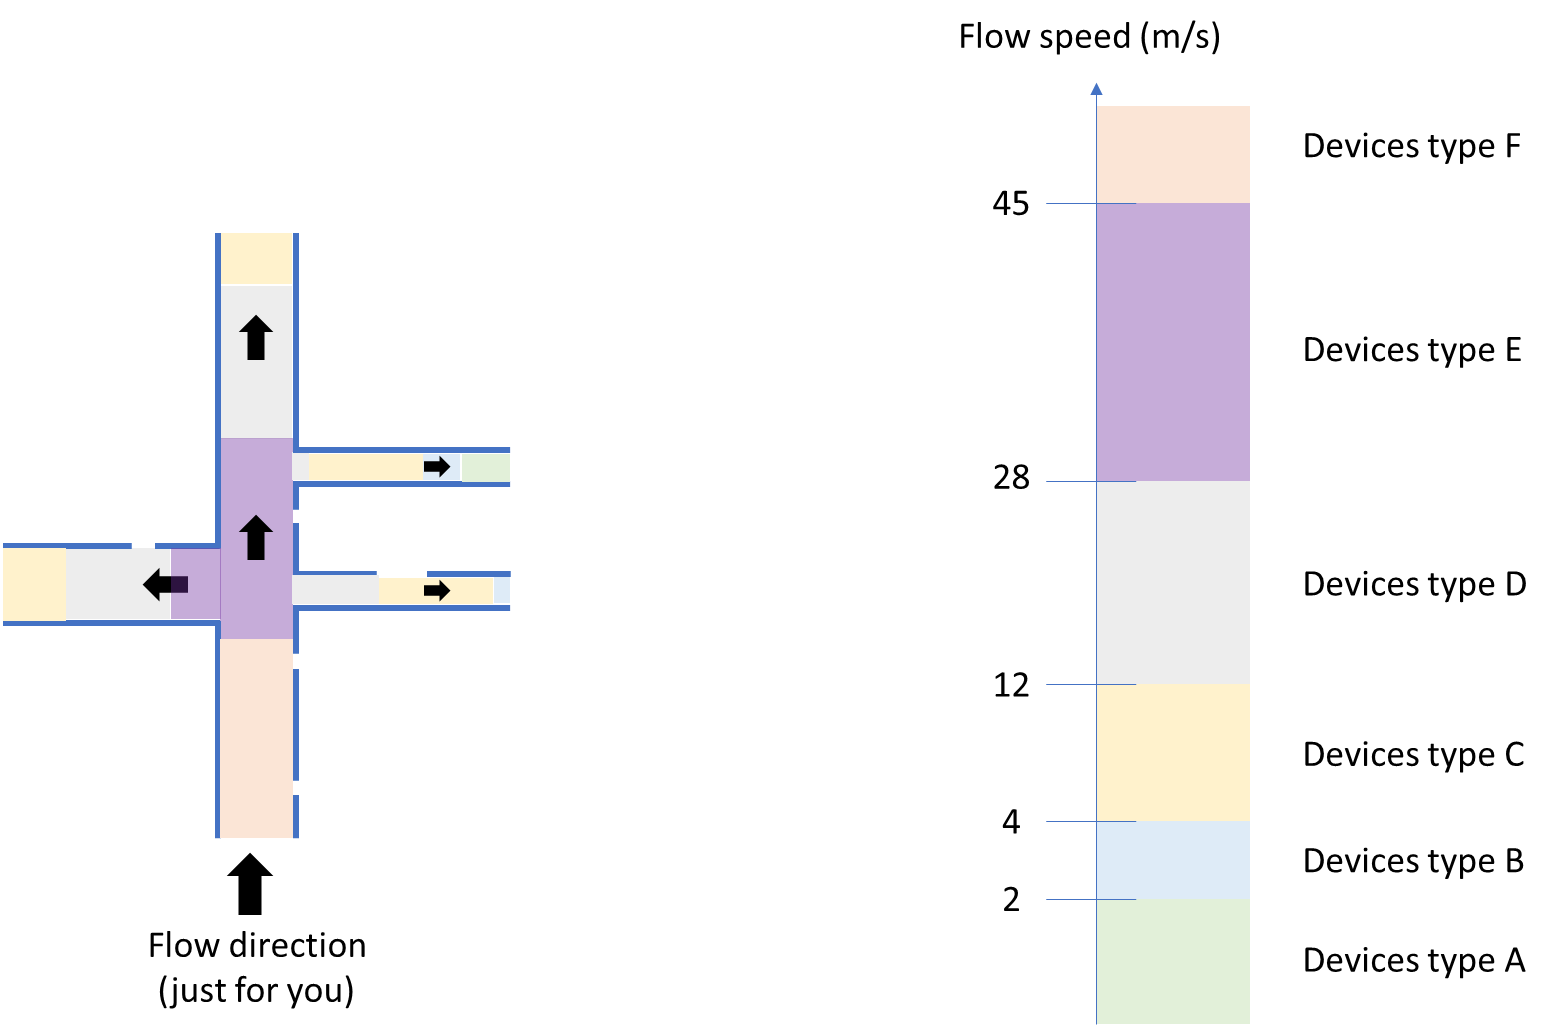
Based on the flow speed in each part of the pipeline network, different kinds of valve will need to be used. I have the working range of each valve and so I would like to create on Paraview a specific visualization scale. Here is an example of what I would like to obtain :
But when I try to create such a scale, it doesn’t work. Here is what I tried :
-
I create a “discrete scale” with 6 intervals (I have 6 intervals in the scale above), but each interval of value is the same and I cannot change this : 3 intervals between 0 and 9 mean one value for 0-3, another one for 3-6 and another one for 6-9
-
I create a “discrete scale” with 45 intervals, I wanted to put the 1-2, 2-3 and 3-4 of the same color, the same for the 8 intervals between 4 and 12, … But I end up with not perfect colors for each interval but a fading from one color to another, and that is not clear anymore.
3 I tried to set my own color scale with a .json file (idea found from this forum) but I also had a fading between the colors.
Does anyone have an idea on how to do this ? I think this problem is really old as I found similar topics without answers that work.
Thank you.