when I plot the temporal data to plot over a line, the length of a line in the X-axis is -0.1 to 0.1 getting a length of 0 to 0.20 while my geometry total X length is 0.16. how is it happening, while I change the length plot reduces. please help me.
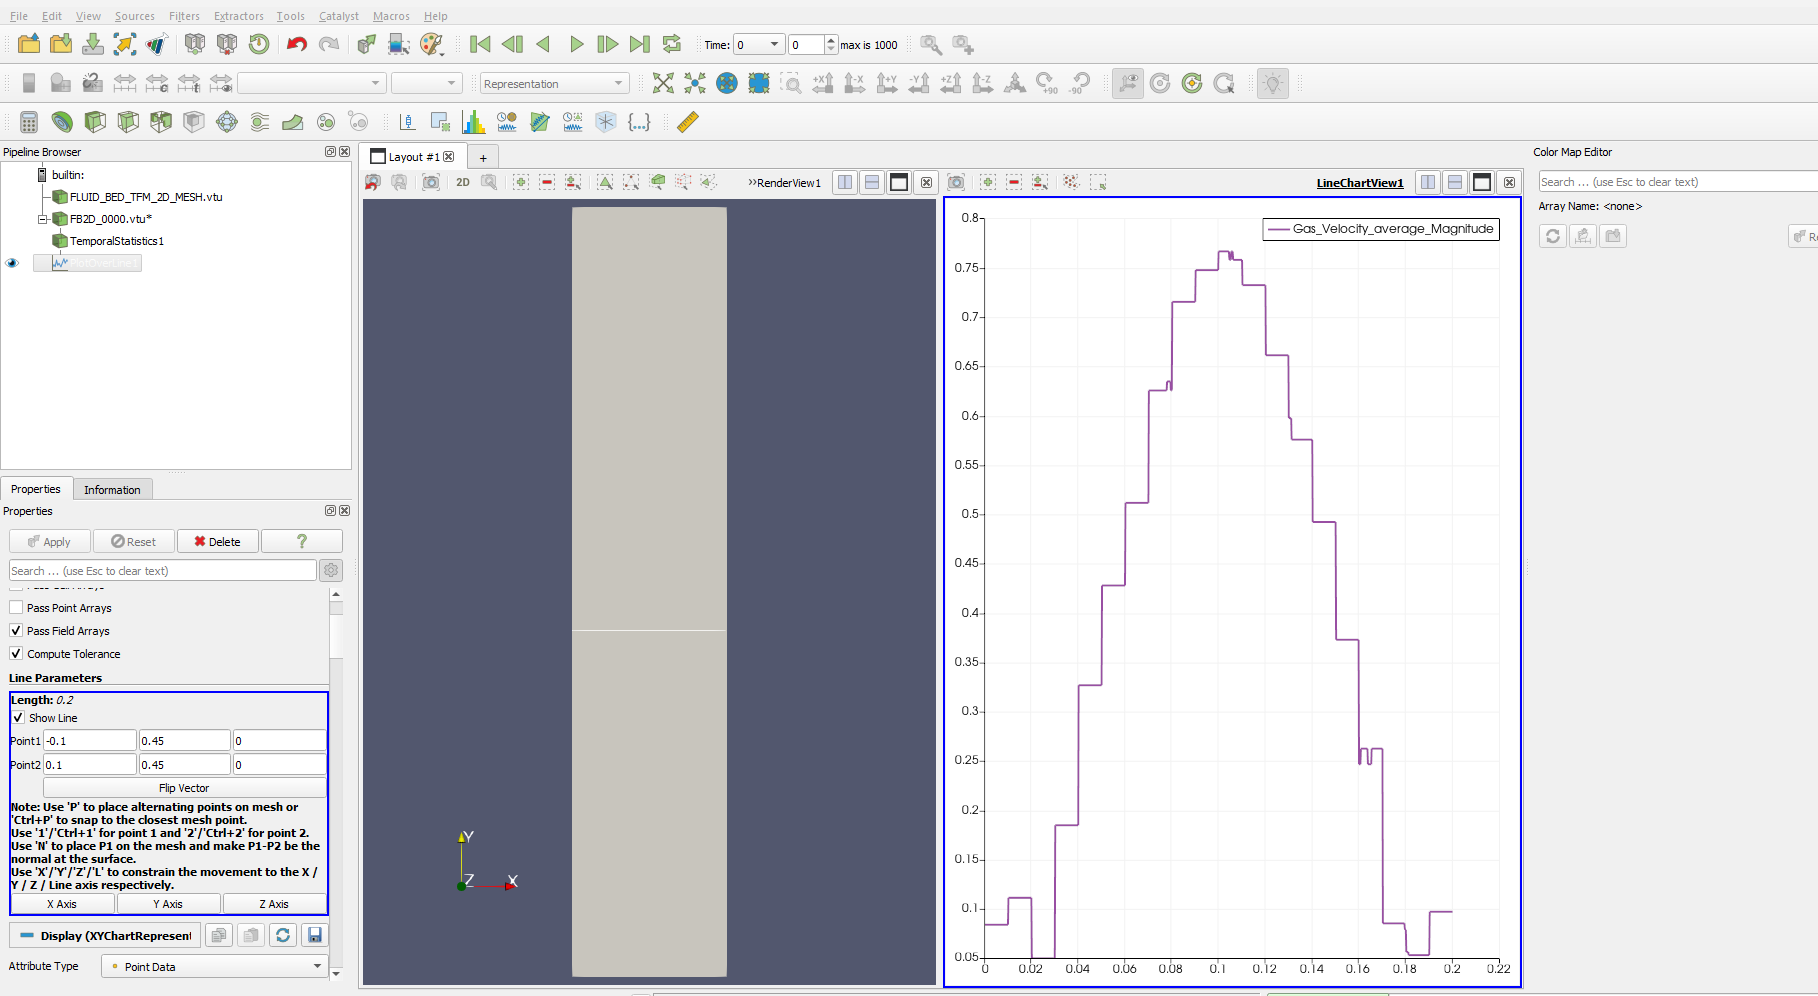
Are you sure the X length of your data is 0.16? What does the Information panel say about the bounds of your data?
Can you share your data?
Thank you for your reply. I check the axis and it is given the same value.
I have one more problem when I follow these steps to plot the data, my paraview window automatically closed. I do not understand why is it happening. can you suggest the debugging?
I DES.FB1.RES in Mfix reader
DES.FB1.DES.VTK
Temporal statics
Extract region surface (this is not taking)
plot over line.
error is coming: ERROR: In vtkDemandDrivenPipeline.cxx, line 779
vtkPVCompositeDataPipeline (000001AEBCA01A60): Input for connection index 0 on input port index 0 for algorithm vtkDataSetRegionSurfaceFilter (000001AEB673C550) is of type vtkPolyData, but a vtkUnstructuredGrid is required.
ERROR: In vtkDemandDrivenPipeline.cxx, line 779
vtkPVCompositeDataPipeline (000001AEBCA01A60): Input for connection index 0 on input port index 0 for algorithm vtkDataSetRegionSurfaceFilter (000001AEB673C550) is of type vtkPolyData, but a vtkUnstructuredGrid is required.
The problem is that you are adding Extract Region Surface on something that is already a surface. ParaView should not have let you add the filter, but the filter does not support this type of data.
If you really want to use this filter, you can first add Clean to Grid first. But in the end you might end up with what you started with because you are extracting a surface from a surface. It might work to just not run this filter.
Thank you for your reply then how can I plot the smooth plot in the DEM case?
Also, I have doubts when I upload the data file DES.FB1.RES in Mfix reader
DES.FB1.DES.VTK my preview window automatically closed. can you tell me what is the reason behind it.