Hi Team. I have a CSV file with x y and z values.
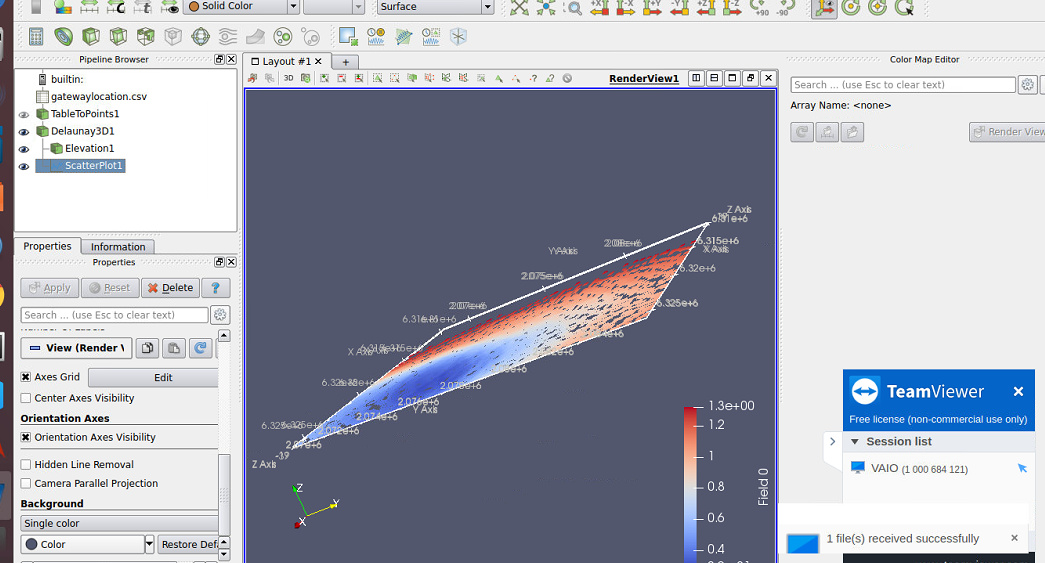
I just need the meshgrid plot for this file using paraview. I did the import csv ->tabletopoints however I am not getting the required 3D view. it is the csv for 6000 x 6000x 6000 points.
I also tried tabletostructure filter but it kept giving me error related to whole extent. I didn’t understand what should be the extent really be.
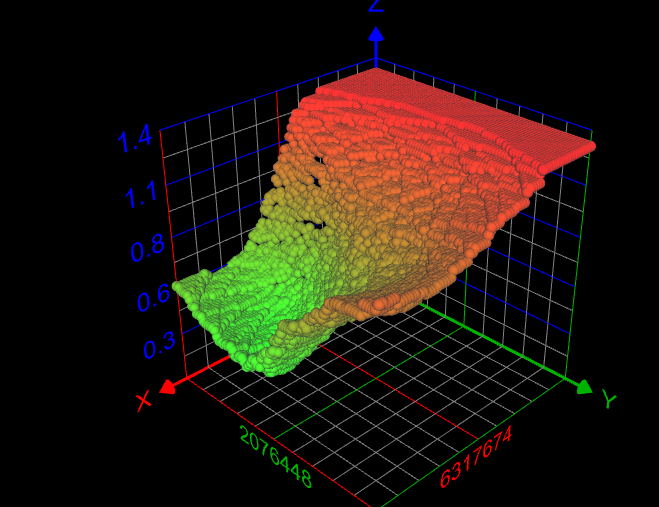
Can you please guide to obtain the 3D view similar to just like in meshgrid similar to second figure in the attachment.
Here x and y are co-ordinates of the area whereas z is the corresponding simulation result.