Creating streamlines

Hello everybody,

I have a velocity field where velocities in one region are much higher than in other regions.

I wonder if there is any way to plot that can help me in visualizing these results.
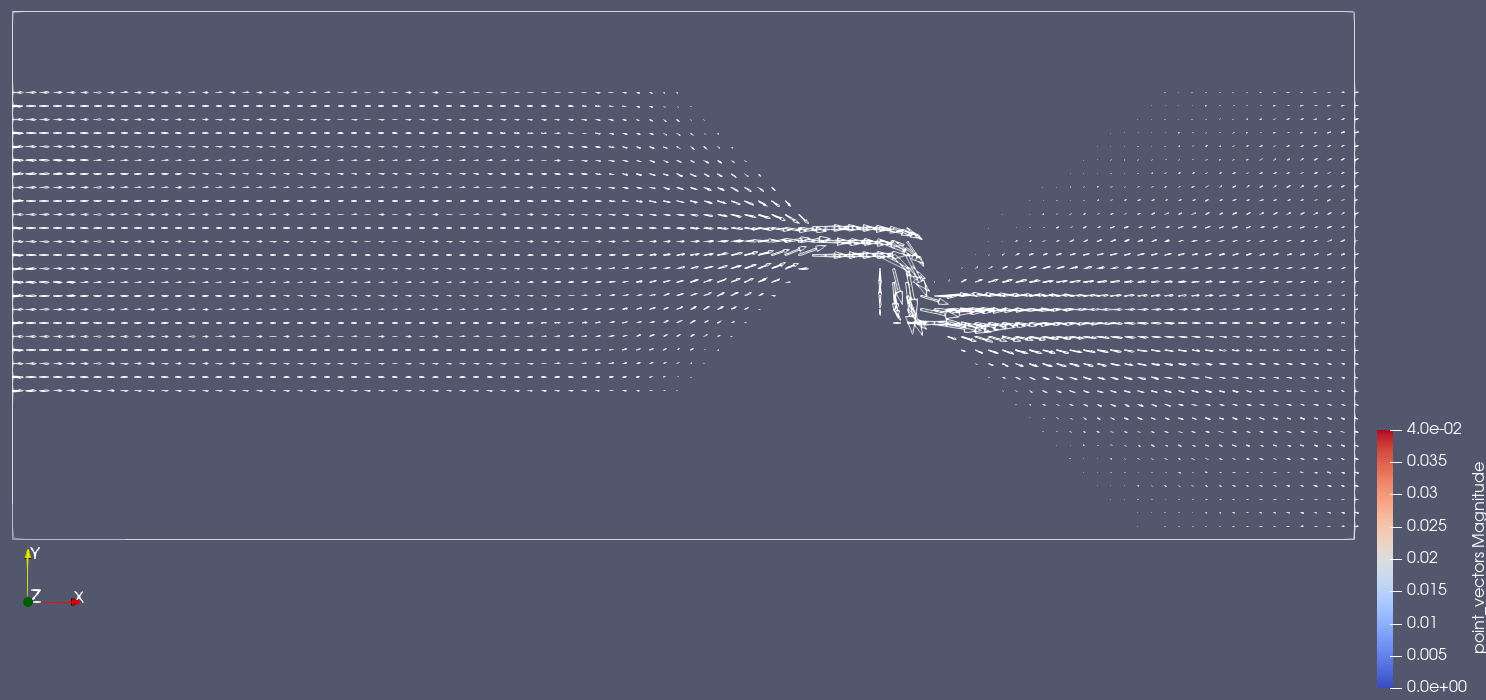
From what I thought, one option would be to select the data that will appear (example: show data every 5 points in x)

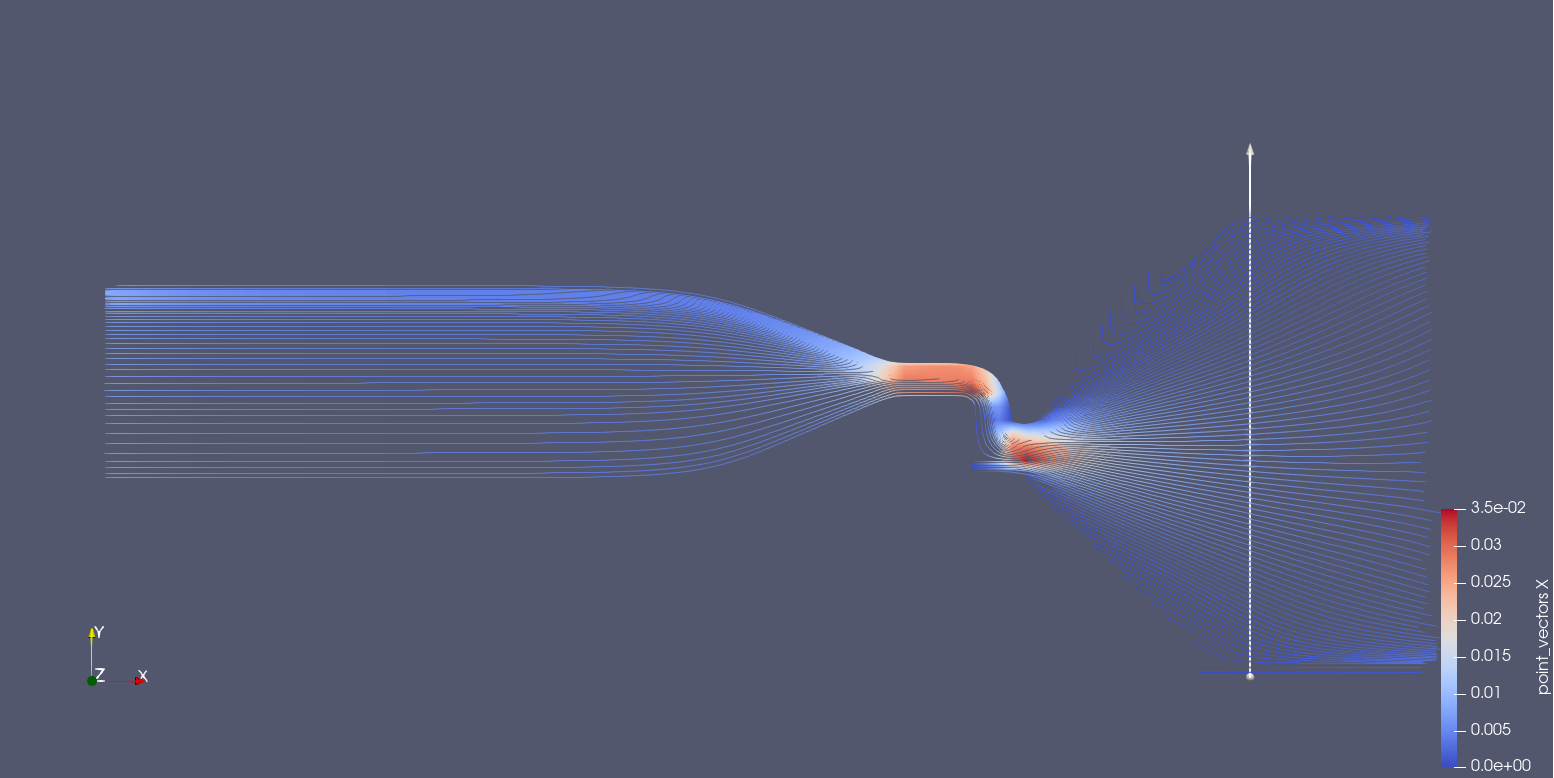
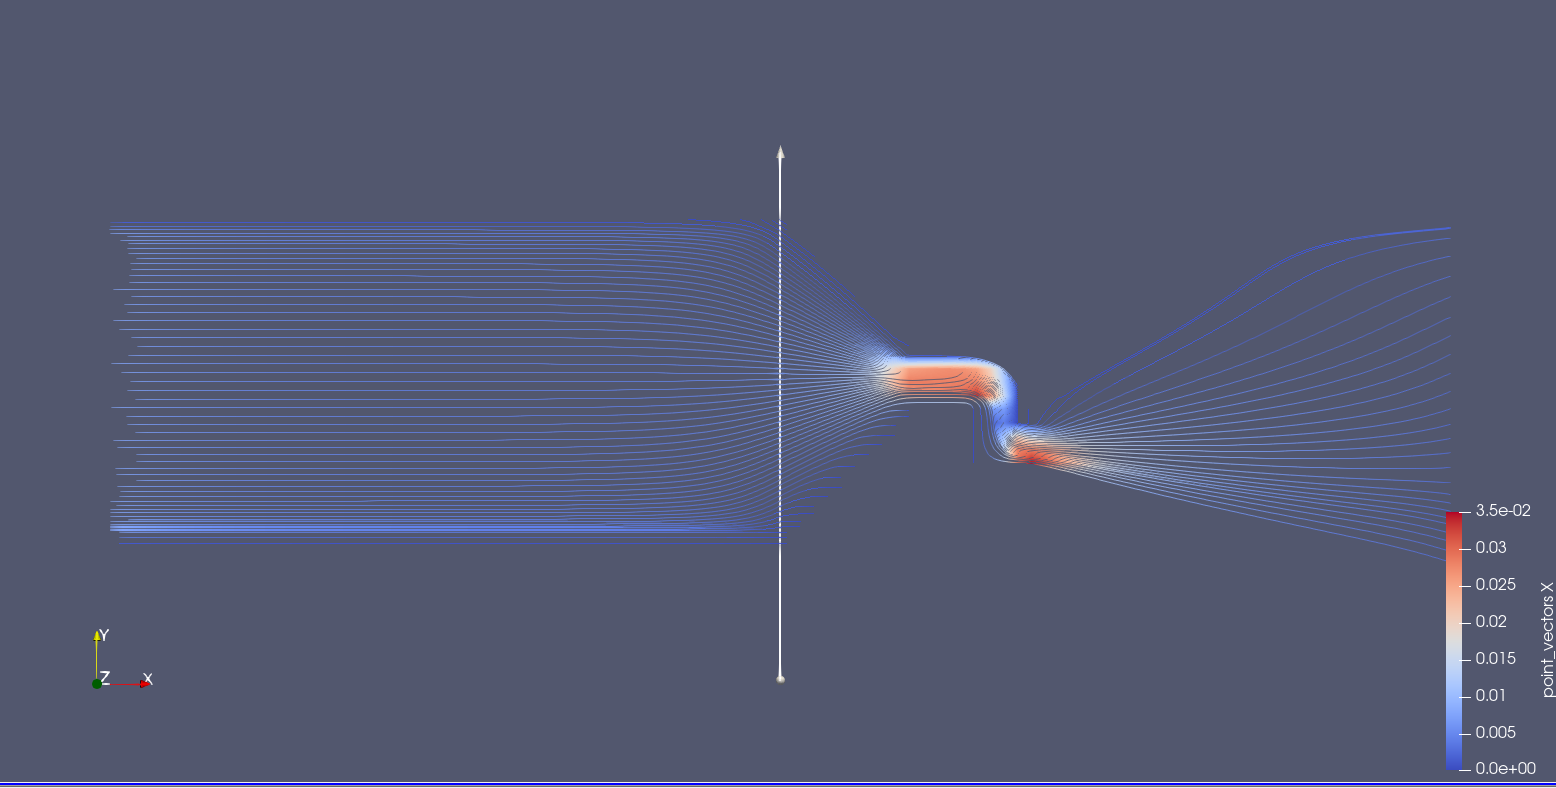
Another option would be to create hydrodynamic streamlines for easy viewing.

Are some of these options possible in paraview?

Is there any easier way to make speed visualizations easier?

Thanks

Filters -> Streamlines ?

Thank you Mathieu, I had not found this option.

Another question, because when I change the parameter line the streamlines change, getting more detailed on one side than the other?

Is there any option that I can make them detailed equally?

Thanks

No idea what you mean. The line is used to generate the streamlines.

You can try
https://blog.kitware.com/evenly-spaced-streamlines-2d/

to have the same density of streamlines everywhere.

Dear Dan Lipsa,

Thanks for the guidelines on the filter.

My velocity field is 3D, with 13 layers in the Z direction. I wonder if there is any way to use this filter in this situation.

Because in my analysis I will need the speed fields only in the first and last layer.

Any suggestion?

Thanks

The vectors would need to be in the plane you want to analyze or need to be projected to be in that plane. In that case it should work by choosing the starting point in that plane as well.

Hello!

Is there an option to place arrows on streamlines? How can I proceed?

The state file included in this blog
https://blog.kitware.com/evenly-spaced-streamlines-2d/

shows you how to place arrows equidistantly along streamlines.

Dear Dan,

My streamline is 3D, do you have the option to put arrows?

Yes, you do. You can use Stream Tracer (instead of Evenly Spaced Streamlines 2D) and then apply the same series of filters (AppendArcLength, Contour and GlyphWithCustomSource)