Hello, I would like to display two 2D rectangular elements in Paraview, whose nodes have coordinates X and Y, nodal values ‘Nodal_Density’ and cell values ‘Pixel_Density’. Since I would need to generalize this problem to unstructured grids, I also provide a connectivity vector, which defines the ordered list of nodes belonging to the cells:
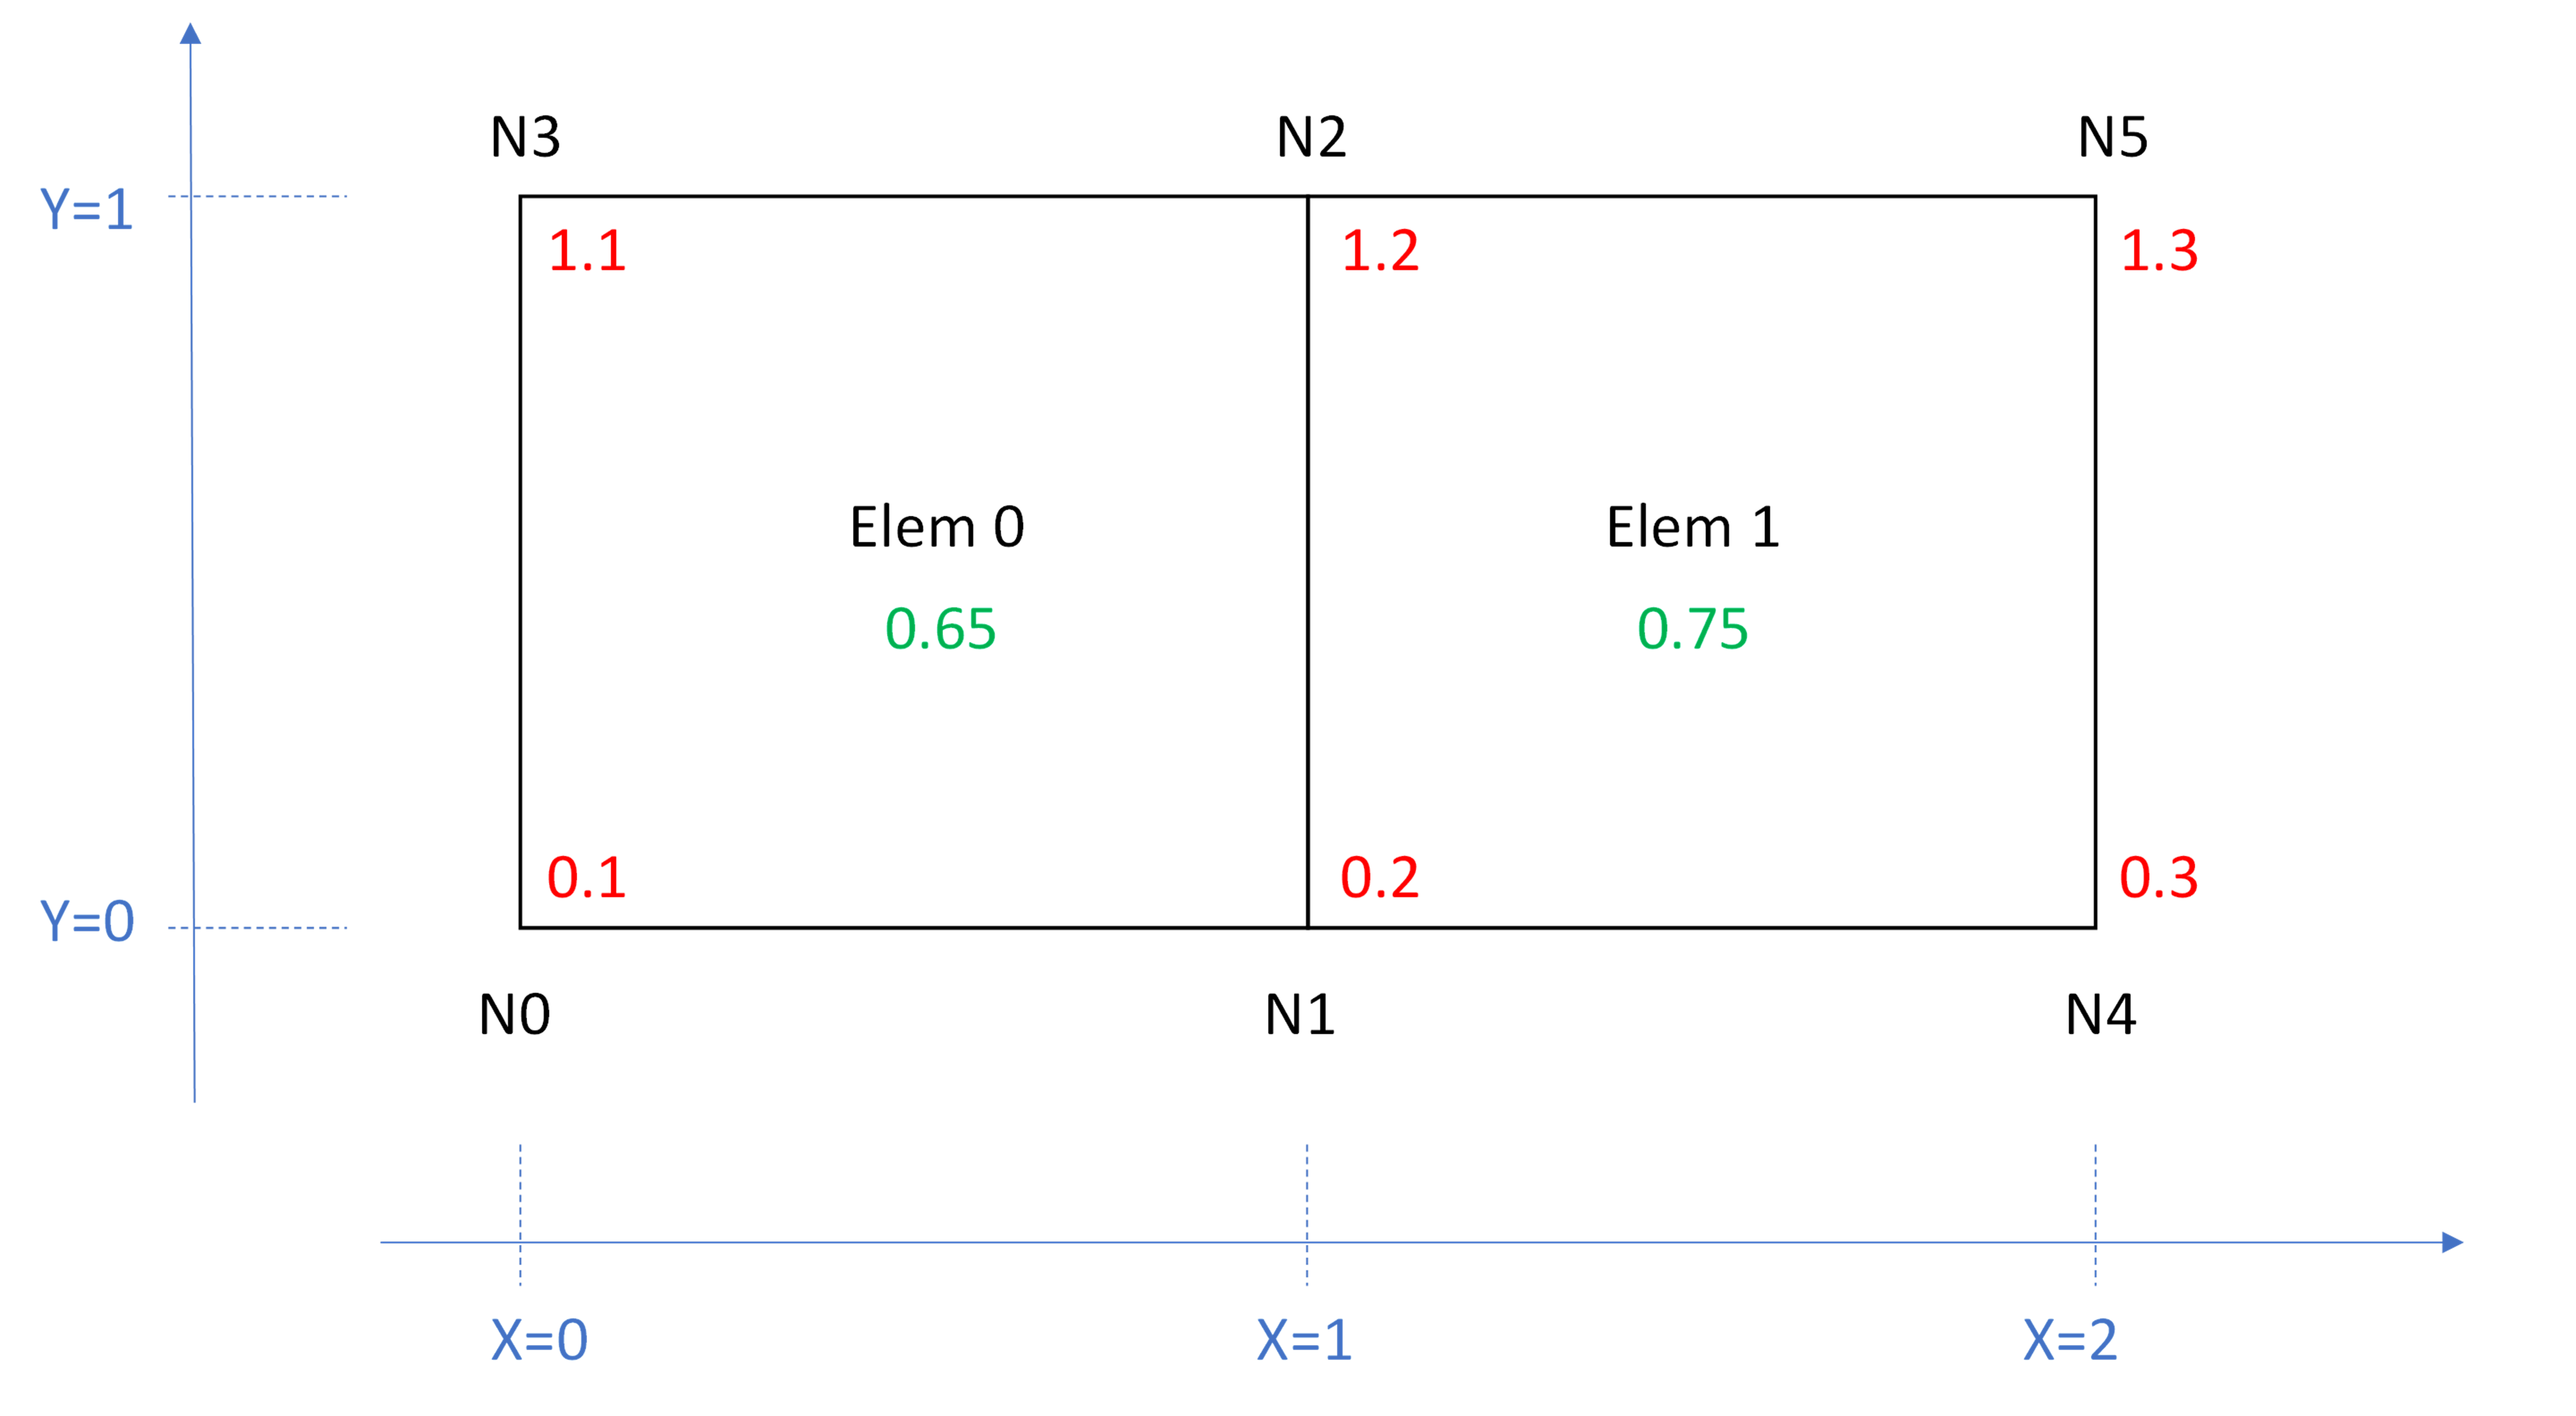
X = [0, 1, 1, 0, 2, 2]
Y = [0, 0, 1, 1, 0, 1]
connectivity = [0, 1, 2, 3, 1, 4, 5, 2]
nvalues = [0.1, 0.2, 1.2, 1.1, 0.3, 1.3] # Nodal_Density
pvalues = [0.65, 0.75] # Pixel_Density
I wrote the following Python script to translate these values into a vtk file to be used with Paraview:
import vtk

def write_legacy_vtk(X, Y, connectivity, nvalues, pvalues):
    # Create VTK unstructured grid
    points = vtk.vtkPoints()
    for node in zip(X, Y):
        points.InsertNextPoint(node[0], node[1], 0.0)

    unstructured_grid = vtk.vtkUnstructuredGrid()

    # Add nodes to the grid
    for i in range(len(connectivity) // 4):
        cell = vtk.vtkQuad()
        conn = connectivity[4 * i:4 * (i + 1)]
        for j in range(4):
            cell.GetPointIds().SetId(j, conn[j])
        unstructured_grid.InsertNextCell(cell.GetCellType(), cell.GetPointIds())

    # Add nodal values to the grid
    nvalues_array = vtk.vtkDoubleArray()
    nvalues_array.SetNumberOfComponents(1)
    nvalues_array.SetName("NODAL_DENSITY")

    for nvalue in nvalues:
        nvalues_array.InsertNextValue(nvalue)

    unstructured_grid.GetPointData().AddArray(nvalues_array)

    # Add cell values to the grid
    pvalues_array = vtk.vtkDoubleArray()
    pvalues_array.SetNumberOfComponents(1)
    pvalues_array.SetName("PIXEL_DENSITY")

    for pvalue in pvalues:
        pvalues_array.InsertNextValue(pvalue)

    unstructured_grid.GetCellData().AddArray(pvalues_array)

    # Write VTK legacy file
    writer = vtk.vtkUnstructuredGridWriter()
    writer.SetFileName('output_legacy.vtk')
    writer.SetInputData(unstructured_grid)
    writer.SetFileTypeToASCII()  # Use ASCII format
    writer.Write()

#-------------------------------------------------------------------

X = [0, 1, 1, 0, 2, 2]
Y = [0, 0, 1, 1, 0, 1]
connectivity = [0, 1, 2, 3, 1, 4, 5, 2]
nvalues = [0.1, 0.2, 1.2, 1.1, 0.3, 1.3] # Nodal_Density
pvalues = [0.65, 0.75] # Pixel_Density

write_legacy_vtk(X, Y, connectivity, nvalues, pvalues)
However, the resulting file is missing most of the input data and it is not clear to me why:
# vtk DataFile Version 5.1
vtk output
ASCII
DATASET UNSTRUCTURED_GRID
POINTS 0 float
CELL_TYPES 2
9
9

CELL_DATA 2
FIELD FieldData 1
PIXEL_DENSITY 1 2 double
0.65 0.75
I am quite new to vtk library in Python and I am not sure about the commands I am using. During the execution of this script, however, I do not get any warning. Thank you very much in advance for any suggestion on how to improve the script or on how to handle the visualisation with a better approach.