Hi Everyone,
I want to import my experimental results in csv format into paraview for visualisation and further to extract results, but let me describe here that structured grid filter needs whole extent to specify… i know how to specify but the problem is my points ( array size ) varies in y and z direction. What should i do here?
I’ve 19 points in x direction
6,7 & 8 points in y direction…
16 & 18 points in z direction…
See , my points in y & z direction varies at some location… at some locations i’ve 6 points or 7 points or 8 points in y direction… similarly in z direction…
I want to know how i can use this filter to visualize or is there any other way i can use?
Any help would be deeply appreciated!
Thanks
Regards.
Not sure to follow. Can you share your csv file please ?
Indeed, your data cannot be converted as a Structured Grid, because the number of point varies. But you can use the Table To Points filter instead.
But with table to points filter can i extract results? I want to plot graphs and to visualize surfaces?
Is it possible with table to points filter?
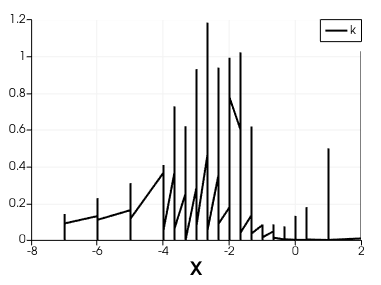
You can plot data directly after loading your csv, without any transformation. For instance, with Plot Data filter:
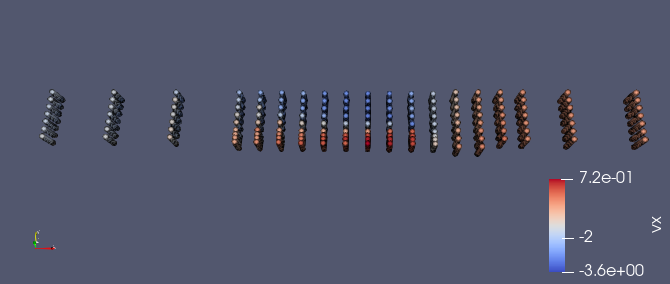
You need the table to points filter essentially to view the data in a 3d view:
Which surface do you want ? Your data define only points, not surface.
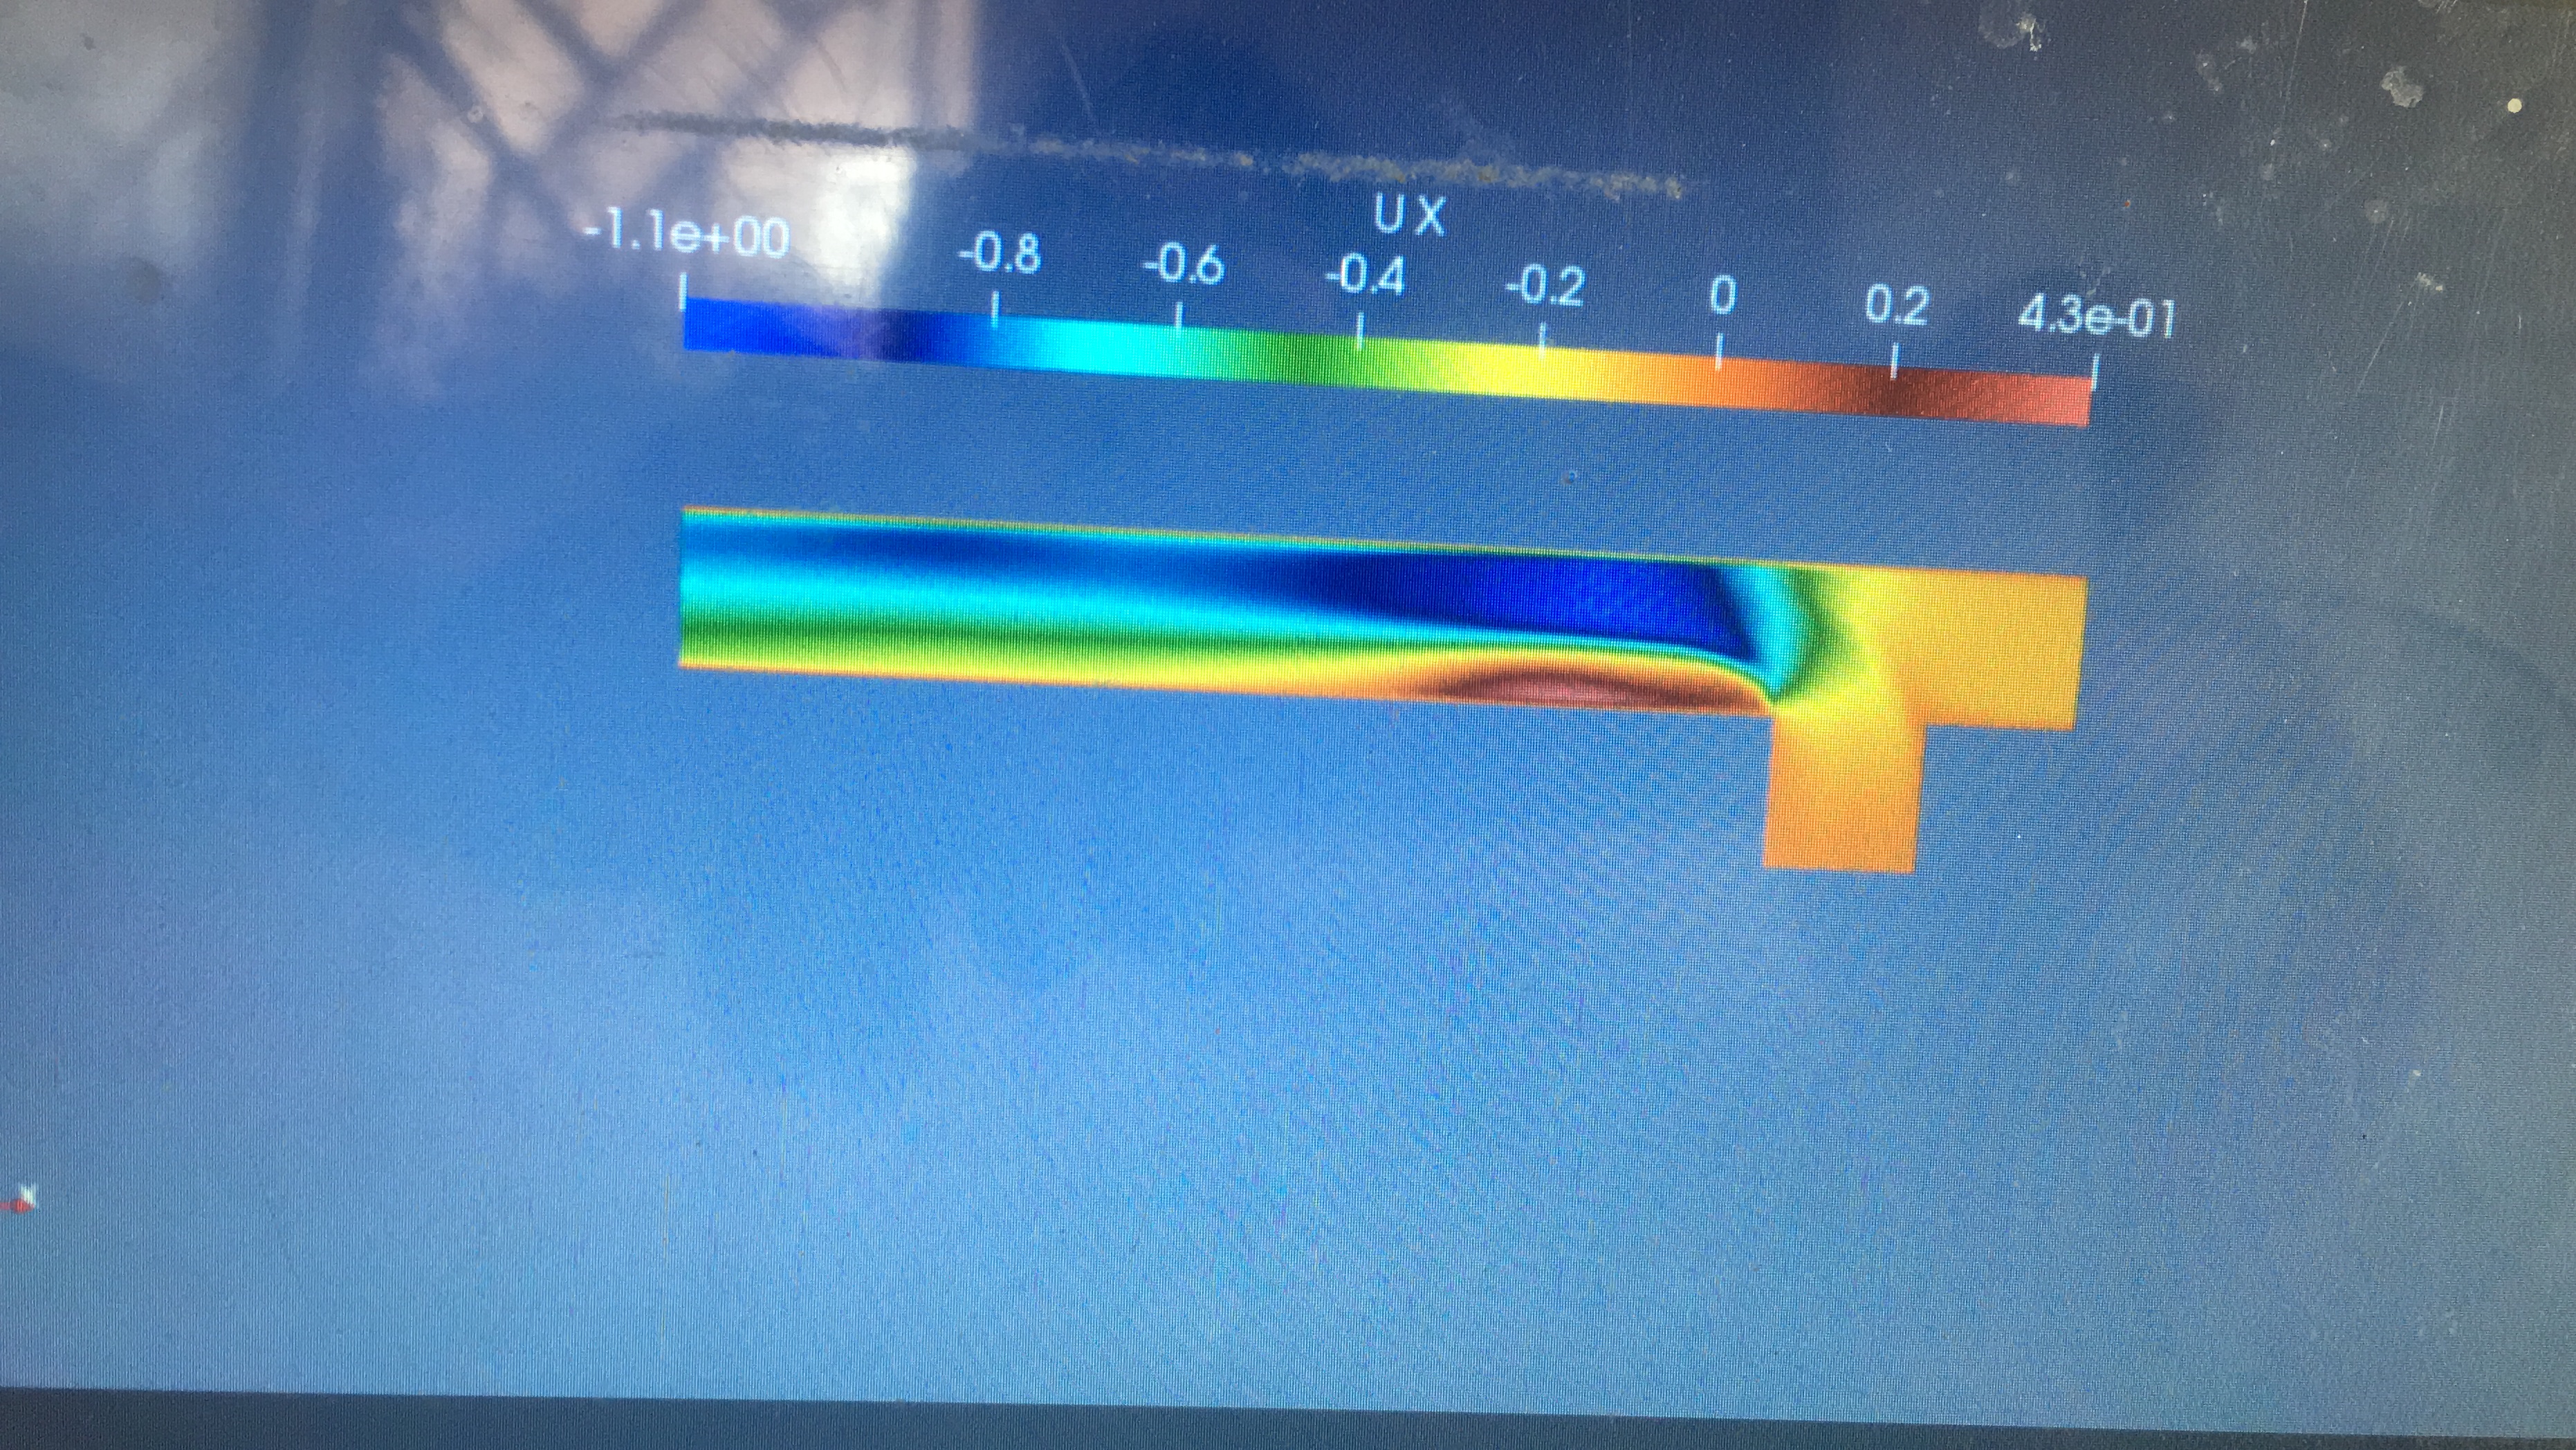
Actually when i will have surface, i want to visualize dfrnt views… from top view velocity patterns, similarly i will cut it to make slices at different locations want to compare with my results…
You see like this … these are my results
You can add a Delannay3D filter after the tableToPoints
Thanks for your reply…
But there’s one more thing i want to share with you and want to resolve.
Actually above i sent you a single csv file which is rectangular in shape, actually my geometry is in T- shape you can see above in the picture. If i want to combine these two files, and make it T- shape, the above dealauny 3D filter will work?
250_main.txt (169.8 KB)
250_side.txt (29.2 KB)
These two files will make together a T- shape channel.
Probably. Try to add a Delaunay3D after each TableToPoints .
Another (harder) solution, if you know python and VTK is to create a Programmable filter and create an unstructured grid from you CSV (or from the TableToPoints output)
No I don’t know python… i will try Delaunny3D after each TableToPoints.
Thanks for your help…
After first delaunay 3D, In second csv file when i upload it into paraview, it doesnot show all the variables in the table. Can you please help me with that