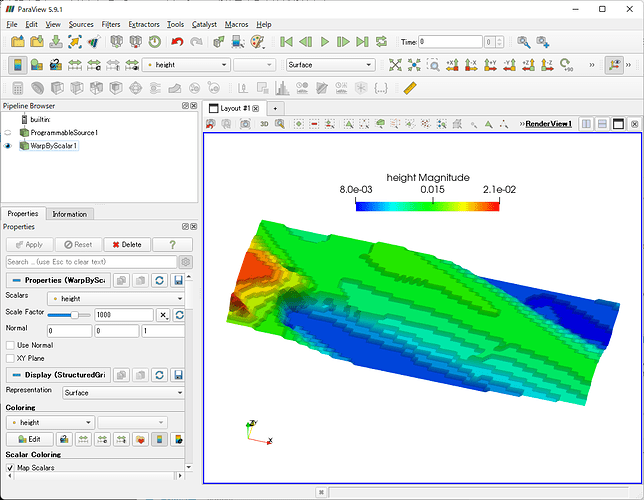
I’m new to Paraview. I have CSV data in table format. So the rows represent Y, and the columns represent X, and for each cell, the Z value is stored. Can I use Paraview to generate the 3D view?
for example, as below, ABCDEFG are columns representing X, and 12345 in the left are rows representing Y. The numbers indicate the Z value.
/t A B C D E F G
1 2 2 3 3 4 4 4
2 1 1 2 2 3 4 5
3 2 2 3 3 5 5 5
4 2 2 22 2 3 4 5
5 4 5 5 5 5 5 5
CSVReader + TableToStructuredGrid should work
Uploading: eye height high mag.csv…
Sample.csv (21.8 KB)
Hi Mat, thanks for the reply. I’ve attached a sample file. The file is not structured as XYZ columns. The columns, A, B,C,D …represent X-axis (they are in arbitrary units), and rows 1,2,…38 represent Y-axis (with arbitrary units), and each cell value represents the Z value (hight). I’m having trouble reading this with Paraview. I’d like to display 3D structure but not sure how. Thanks.
One way to achieve this is to use a Programmable Source.
- Source > Alphabetical > Programmable Source
- Fill in the Script (RequestInformation) as shown below.
from paraview import util
util.SetOutputWholeExtent(self, [0, 98, 0, 37, 0, 0])
Here, the values to be specified for SetOutputWholeExtent are obtained by counting the number of rows and columns from the csv file in advance.
- Enter the following in Script.
import numpy as np

path = 'data_path/Sample.csv'
a = np.loadtxt(path, delimiter=',', encoding='utf-8_sig').flatten()

output.SetDimensions(99, 38, 1)
output.SetOrigin(0.0, 0.0, 0.0)
output.SetSpacing(1, 1, 1)
output.PointData.append(a, 'height')
Here, path is the absolute path to the location of Sample.csv. And set the number of rows and columns in the csv file in output.SetDimensions.
-
Specify vtkImageData as the Output Data Set Type.
-
Apply
-
Continue to apply Filters > Alphabetical > Warp By Scalar, as shown below.
The state file for the above operations is attached.
programmable_source.pvsm (292.2 KB)
Thank you for the very detailed reply. I’ll give it a try. Much appreciated.
