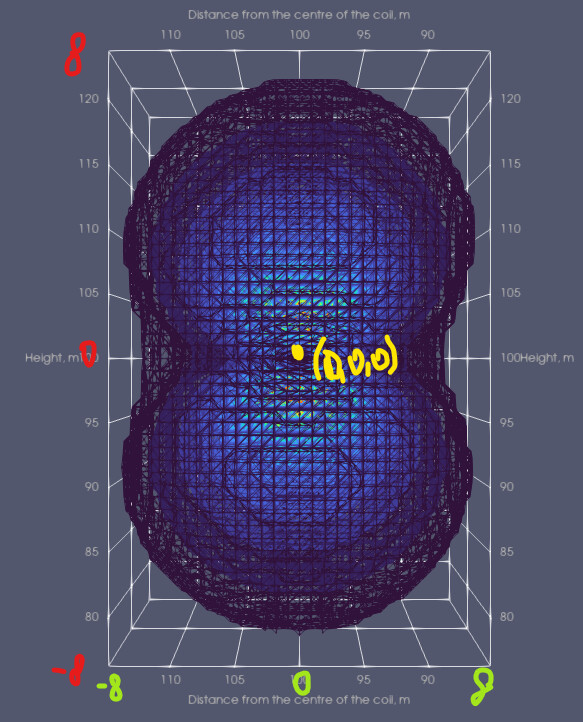
Hi, I am new to paraview and I have the following issue: I am using MATLAB to calculate magnetic flux density around an object in space where (0,0,0) is the origin of the object. When i bring the data into Paraview, it plots well, however I would like to change axis (not just scale them) to be from -8 to 8, how can I do it?
I am showing what I mean on the figure below:
Also, while we are at it, is there a way to scale the volume scalars from 0 to 100 to other value range?
Many thanks!