I want to plot something like a histogram of six grid variables at each point. Is this possible to do in paraview, or am I going to be doing something more custom?
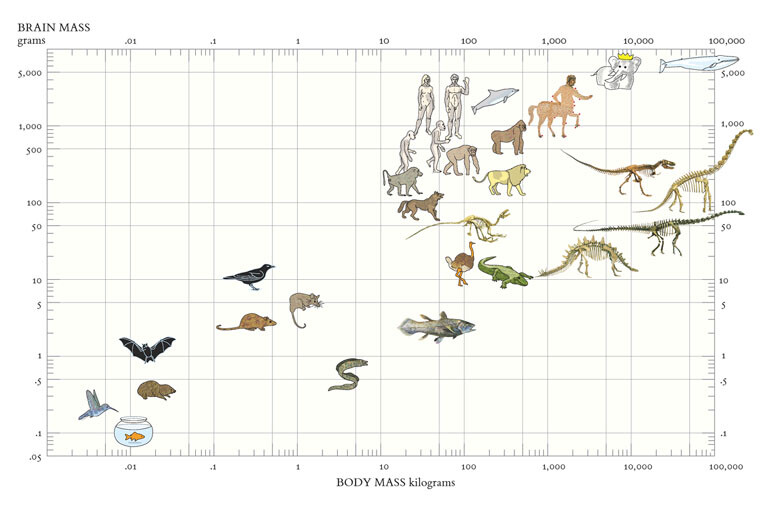
Imagine something like this, but with some sort of graph instead of a figure, and organized on a spatial grid.
It looks like what I want is available in VTK: VTK: vtkProgrammableGlyphFilter Class Reference.
Is this something I could expose in Paraview as a simple XML plugin? I suppose I’m mostly worried about the function pointer, and whether it could take a python function.
Nathan,
One possibility is to use the “3D Glyphs” representation. It has an option in the Properties panel named Use Glyph Table. This features lets you designate a point data array that specifies a glyph index. The glyph index is used to lookup a glyph within a composite dataset that you provice, which you can create with the Group Datasets filter.
Other relevant properties are:
- Glyph Type - set this to “Pipeline Connection”
- Input - set this to your GroupDatasets filter
- Use Composite Glyph Table - set this to on
When you have everything set up right, you’ll get different glyphs in your Group Datasets filter at different locations in your dataset.
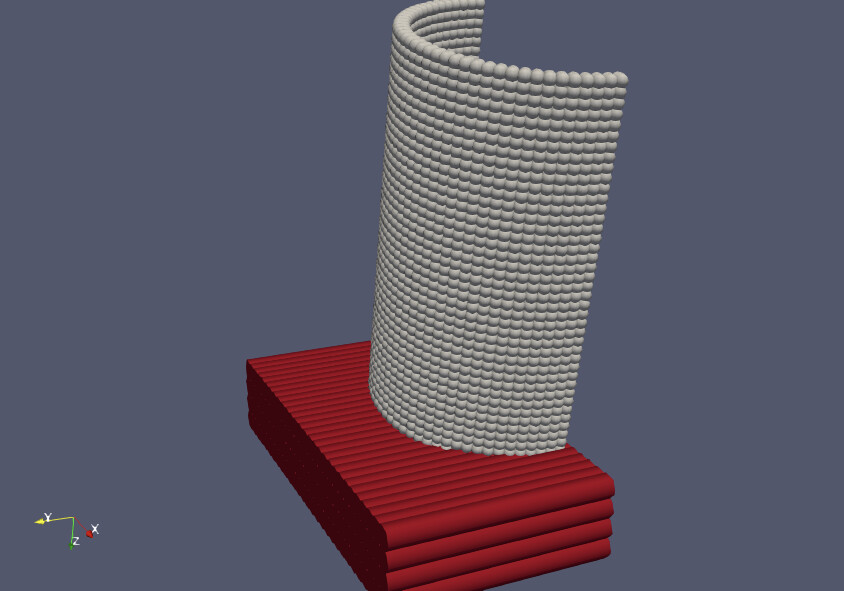
Attached is an example. It uses the can.ex2 example file and massaging the Object ID cell data array into a GlyphIndex point data array, then sets up a composite dataset with a source and cylinder. The end result is spherical glyphs on one object and cylindrical glyphs on the other.
GlyphTable.pvsm (913.8 KB)
This is an approach I hadn’t considered, but it seems too unwieldy for what I’d like to do. My goal is to derive each glyph from the data at the specific point, so that each glyph is a tiny histogram or line plot of a small number of variables.
The programmableGlyphFilter looks like it does exactly what I want, but I always struggle when I have to work with VTK directly.