Data array displaying

Hello. Help me please. I try to visualize 3 local axes, of line finite element. My exodus file was obtained from moose framework.
Before it execution i outputed local axis vectors in terminal:
It looks like this:
x_orientation(x,y,z)=( 1, 0, 0)
y_orientation(x,y,z)=( 0, 1, 0)
z_orientation(x,y,z)=( 0, 0, 1)

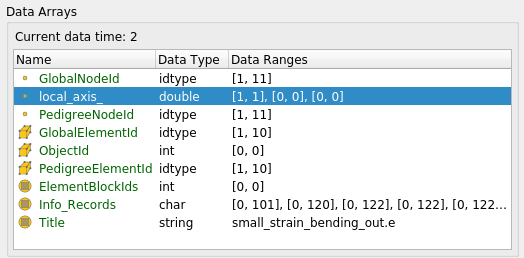
But in paraview i see the next data:
изображение
local_axis_ is that i want to display. And the one direction is currently displayed.


Tell me please, could these vectors correctly displayed as expected.

Thank you.

small_strain_bending_out2.e (89.7 KB)

They already are, you data contains only 1 for the X component and 0 everywhere else.

Thank you. I think that data needs to be changed in MOOSE.

1 Like

@mwestphal can explain me this what this notation means in paraview: [1, 1], [0, 0], [0,0]?

It means that you data:
X component contain data from 1 to 1
Y component contain data from 0 to 0
Z component contain data from 0 to 0

@mwestphal, so if i need to visualize one vector this way is it enought 3 numbers?

I have no idea what you mean, but it means that all your vectors have the same value, 1,0,0

Thank you @mwestphal. I meant, that each component of the vector defined by 1 number. So i have 3 vectors with 3 components in each one. Then local axes are displayed fine.