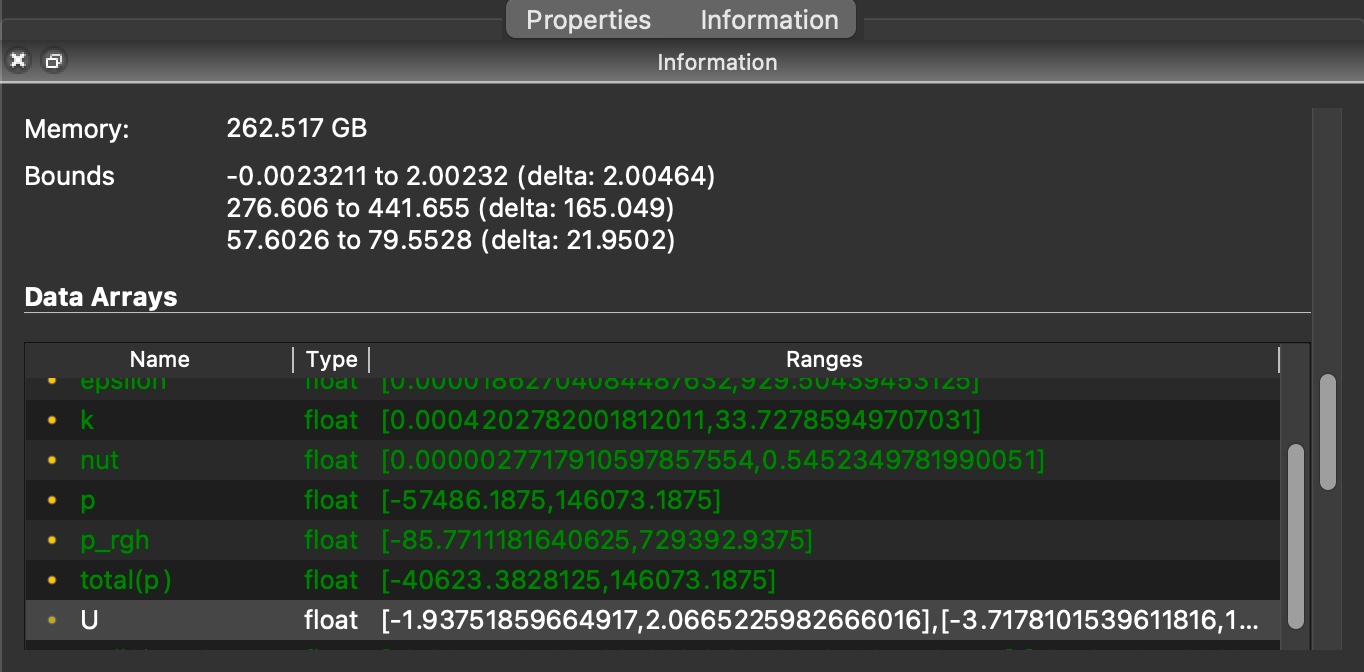
It’s not too bad for single component arrays but for 3 component arrays (like the highlighted one in the attached image) it’s pretty hard to see the third component range. I’m wondering if the precision should be reduced (and maybe formatting changed to something like scientific notation) to make this information more accessible.
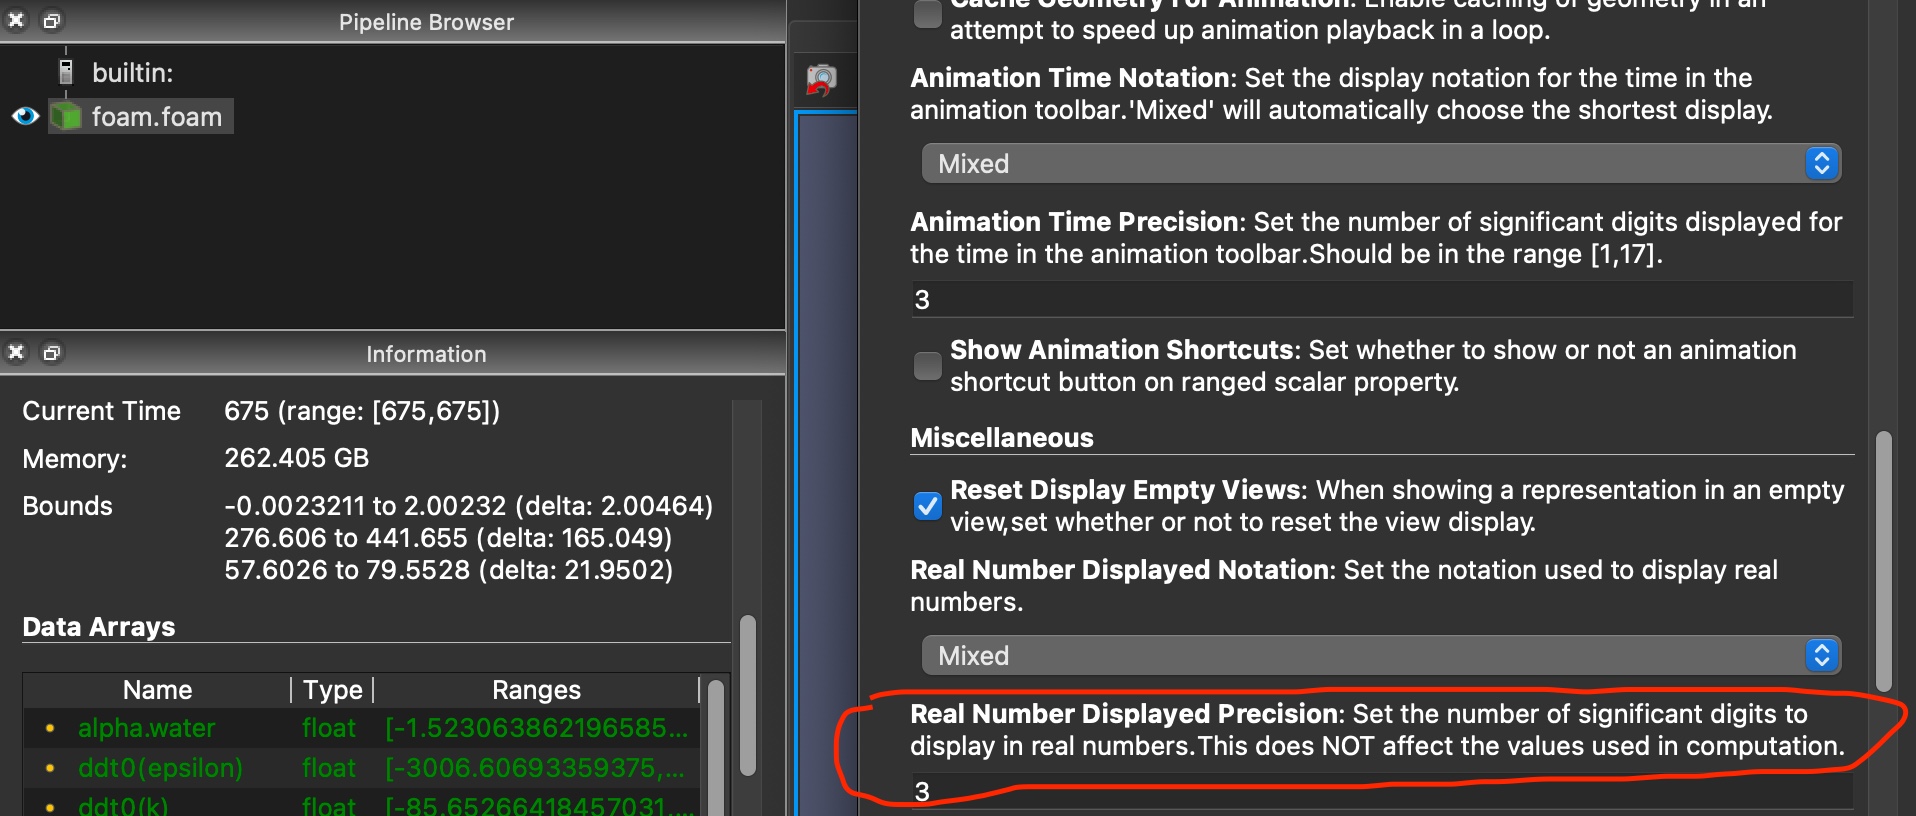
Note that I’m using the 5.11 installer from the PV download site and this is on MacOS 12.6.3, in case any of that helps.
I wonder if we should add a quick option to toggle the precision to full res on the Information tab. The reason why we showed full resolution for numbers on the Information panel is because these values may be used as filter params etc, where full precision is necessary for accurate results. Forcing the user to have to change the global setting to see full res each time may become odious.
I was thinking another potential solution may be having an option to expand out to each component of the tuple. For example instead of a velocity vector range in a single line the display would show x-velocity range, y-velocity range and z-velocity range on separate lines. I’m not suggesting that this is the proper solution. Just throwing alternate ideas out there.