Hello
I am a new user of paraview and I have a question about the format of datas files.
I have a series of 3D dots in an XYZ landmark and for each point I have a daily temperature measurement.
I would like to visualize in 3D these temperatures in the form of solid for example and use the time steps to see their evolution.
I created a .CSV file with XYZ data and temperature measurements in columns with dates in the header, I can load it and view it but I can not exploit it.
I did not find in the manuals and tutorials how to write the data file.
Do you have any indications to guide me?
With my thanks to the community
Welcome to the ParaView community !
please share your .csv file.
Hello
Thanks for your prompt answer
Here attached the CSV file containing data.
Tous thermocouples tubes dates.csv (76.2 KB)
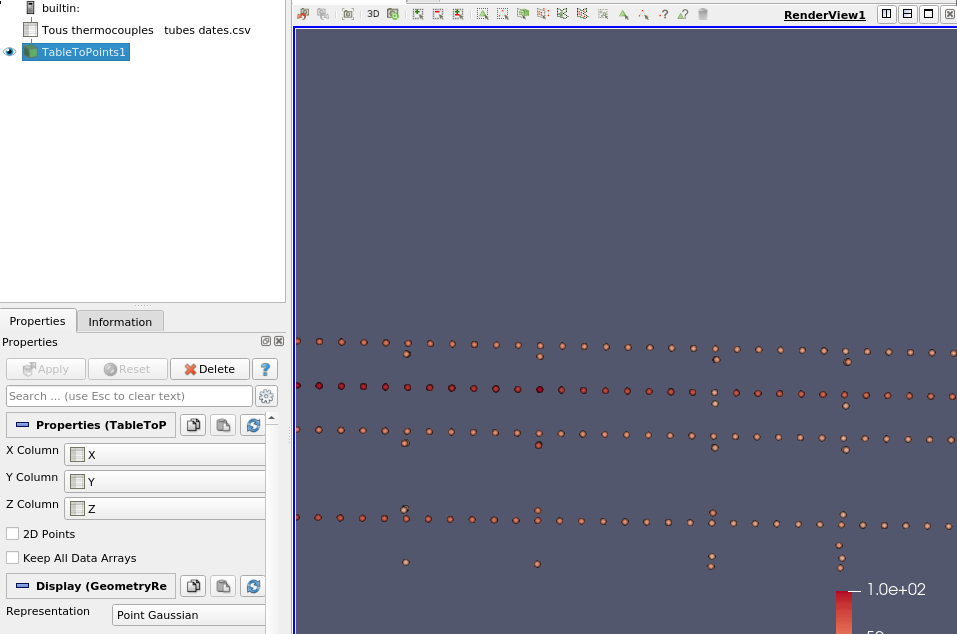
Works fine !
I had just to modify decimal separator and date format to use this filter correctly.
thank you !
I now have only to manipulate the data to have volumes with interpolations and time steps.
Still a lot to discover with this software
thanks again
With Mathieu’s great help, sounds like you are on your way. Here is a wiki reference for future folks trying to visualize points in a .csv file: https://www.paraview.org/Wiki/ParaView/Data_formats