Hello,
I made this geomodel that visualizes the UCS data.
And I want to add the volume that visulizes the expected UCS data which interpolated by GaussianKernel(IDW method).
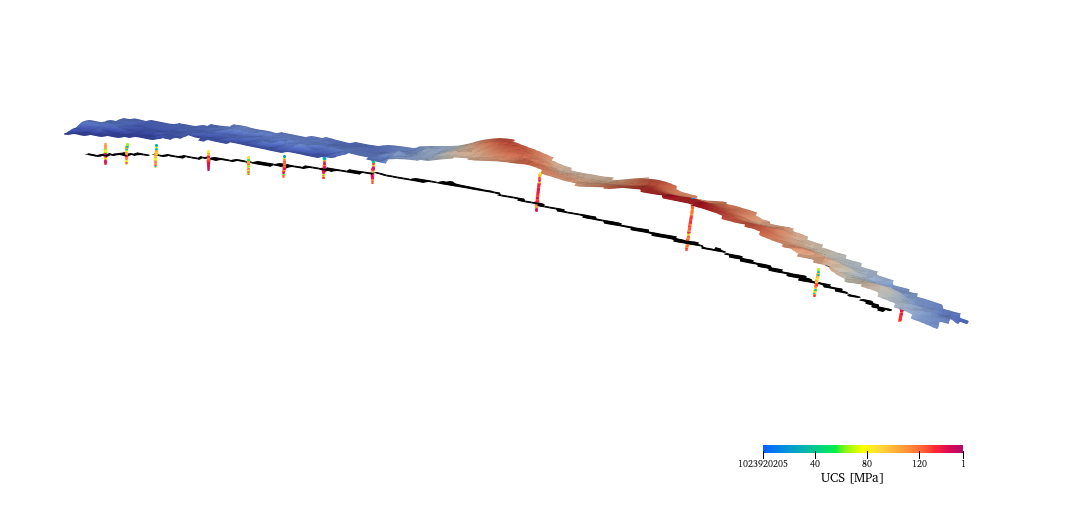
But as you see at the right side of this image, the result data is weird.
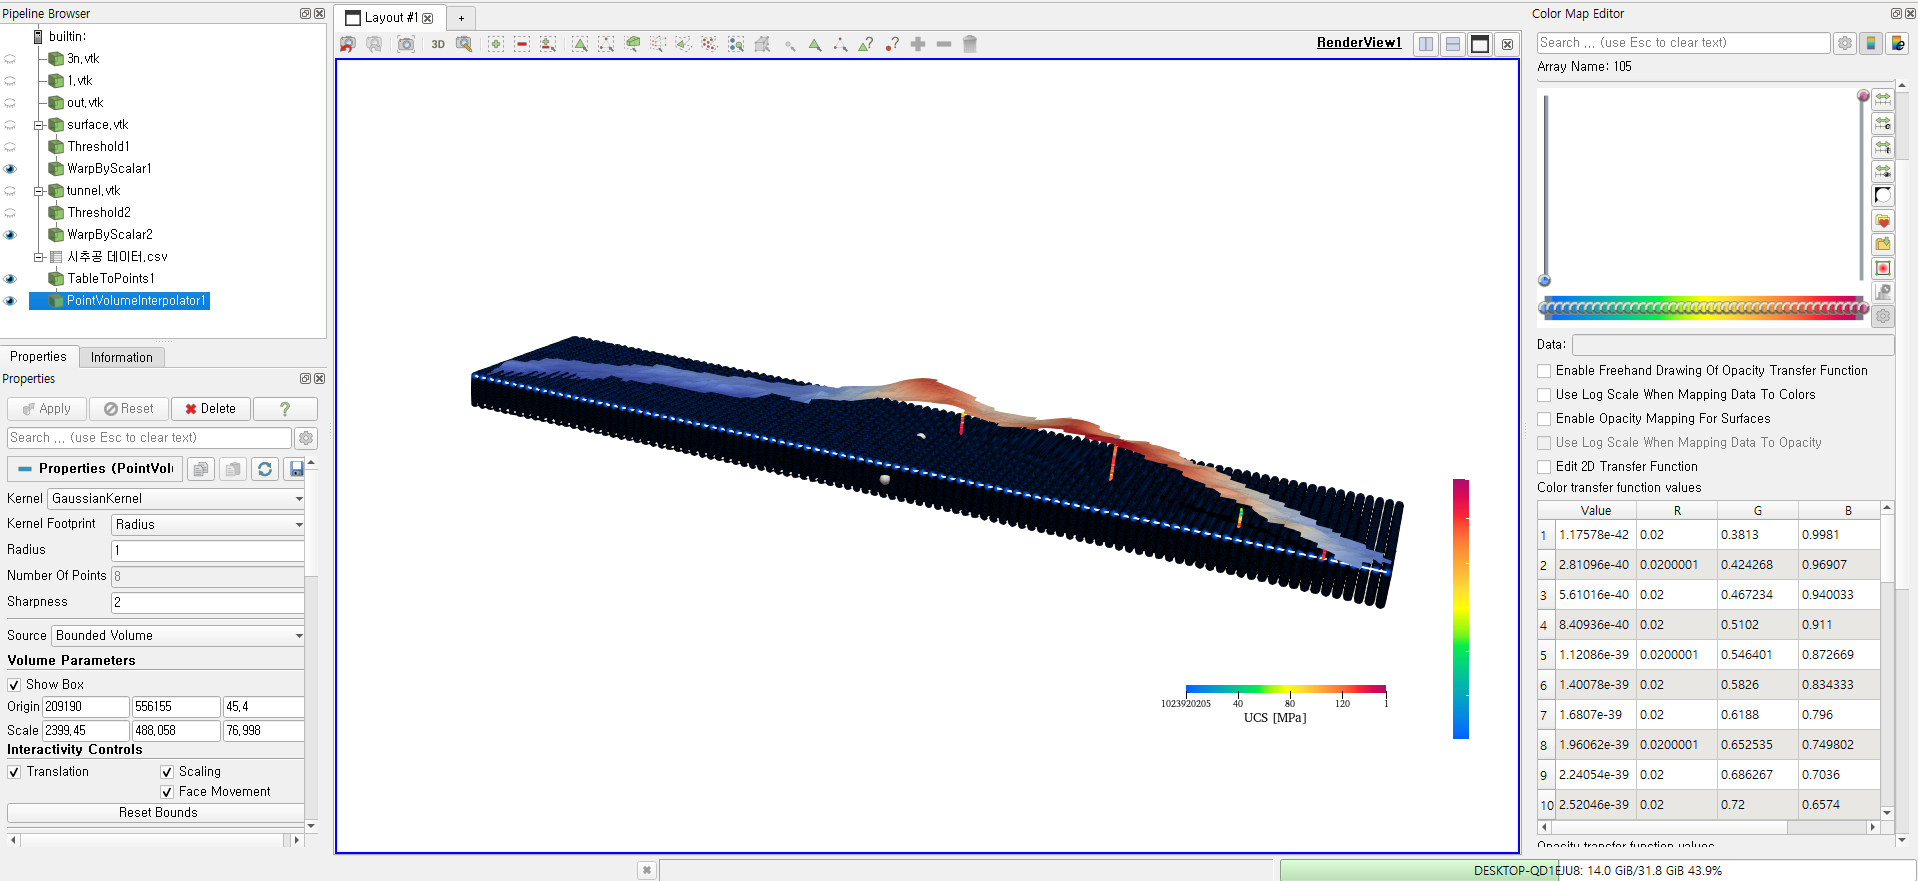
Even though the original UCS data range is 15~150(MPa), all of the interpolated data is almost 0.
Could you please help me to solve this problem?