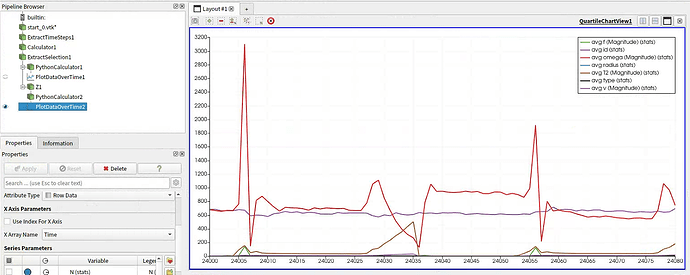
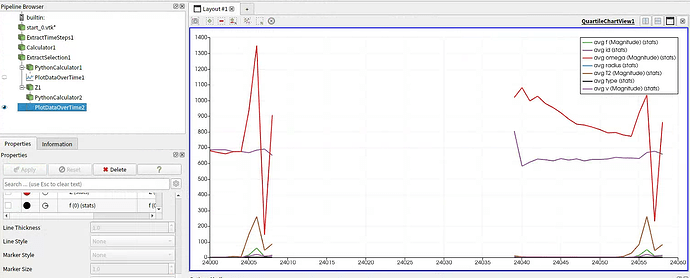
Hi all, I recorded a script in ParaView as shown in Figure 1, and then used the script in a new interface to visualize the data. However, I found that there is some missing data in the plot. Does anyone know what might be causing this?
test06.py (3.5 KB)
Please share your data
Thank you for your reply. Since the file is too large, I have uploaded it to Google Drive.
Your script extract timesteps from based on the time values, which are not extracted when reading a time series, sadly.
You may want to create a .series file or a .pvd file to specify the time values.
could you please tell me how do to specify time variable in ParaView, or does it mean that need to change the data export format?![]()
A .series file like this let you specify the time value.
Thank you very much. I followed your advice to address the issue of data interruptions. However, when I attempted to extract and freeze partial height data, I found that the script did not execute this step. I noticed fluctuations in the IDs of particles in the graph, which is different from the graph without using the script. Could you help me?

