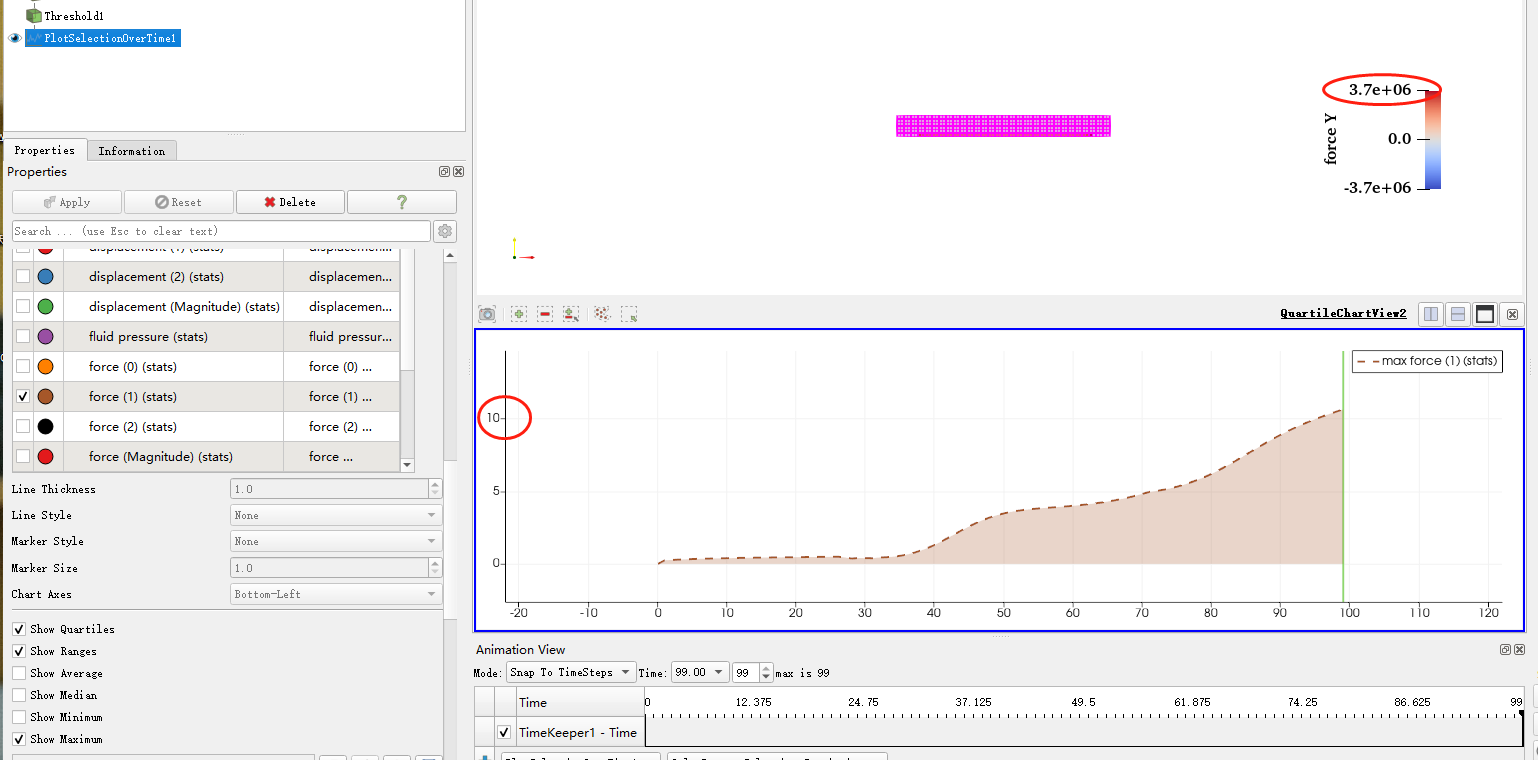
Hello! I encountered a strange problem using paraview. When I view the variable force_Y through the color map, the maximum value is 3.7e6. But this is not the case with plot selection over time. The maximum force_Y is only about 10. I don’t know why.
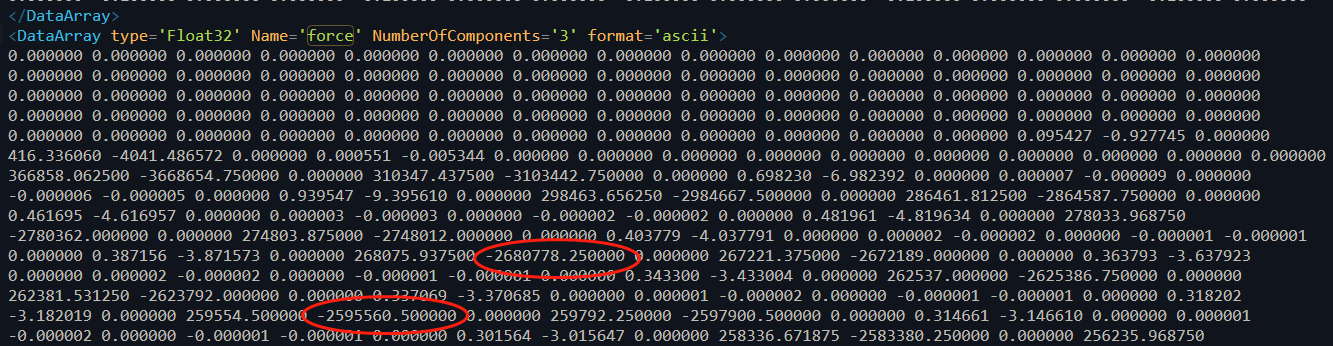
I checked my .vtp output file. There are some values close to 3e6 in the output results. So what’s the problem?