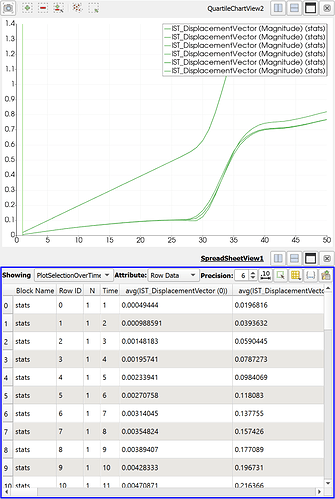
Hello, I have been trying to find a way to plot and show a spreadsheet of the selected points’ displacement data over time, but the plot over time, or spreadsheet view, will show average, min, max, etc. over time and not each point separately.
It is possible to achieve what I want if I select points one by one plot them over time, but that is very slow and cumbersome task plus the spreadsheet will only show one point.
Is it possible to plot selected points’ data with individual curves and extract the data over time in the same CSV file?
Both Plot Data Over Time and Plot Selection Over Time have an option named Only Report Selection Statistics. If you turn this option off, the filter will compute the time series of each point/cell independently, which I think is what you are asking for.
The output when you use this option is a little weird. You get a multiblock dataset with the timeseries for each point/cell in its own block. You can select each block independently in the Display part of the properties panel for the chart views, or you can use the ExtractBlock filter to pull out the line series that you want.
Note that ParaView is not a database program, so don’t expect great performance in managing and subselecting lots of tables of data.
That’s exactly what I needed, I could never relate that to “Only Report Selection Statistics” by myself ![]()
