I am trying to visualize a .vtk file produced with PyVista (python wrapper of vtk).
I opened the attached .vtk file in paraview v5.9.1, which I am running on Windows 10. EC.vtk (3.0 MB)
The file is just an unstructured grid with data associated with each local node of the mesh. The data written in the file is a scalar field (one value per local node).
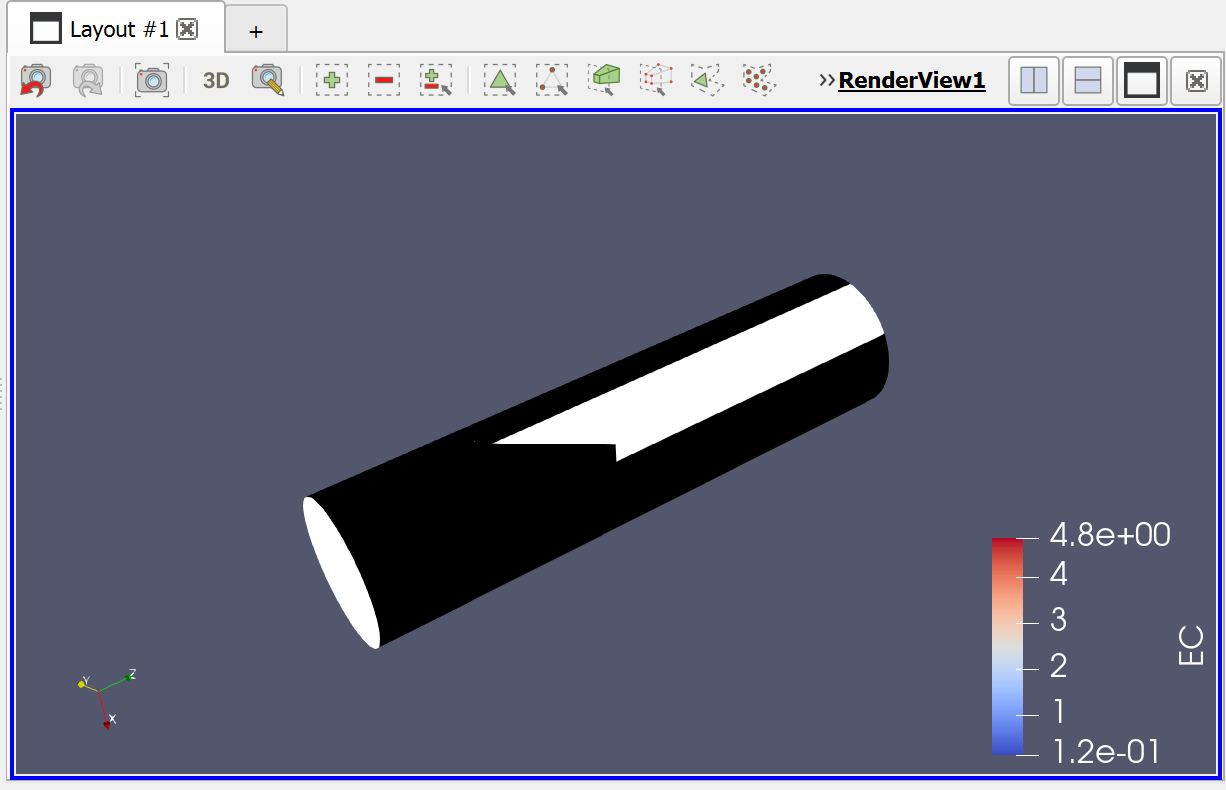
When loaded in paraview, the data does not appear correctly. Instead of seeing the expected density plot, I see some buggy black and white image:
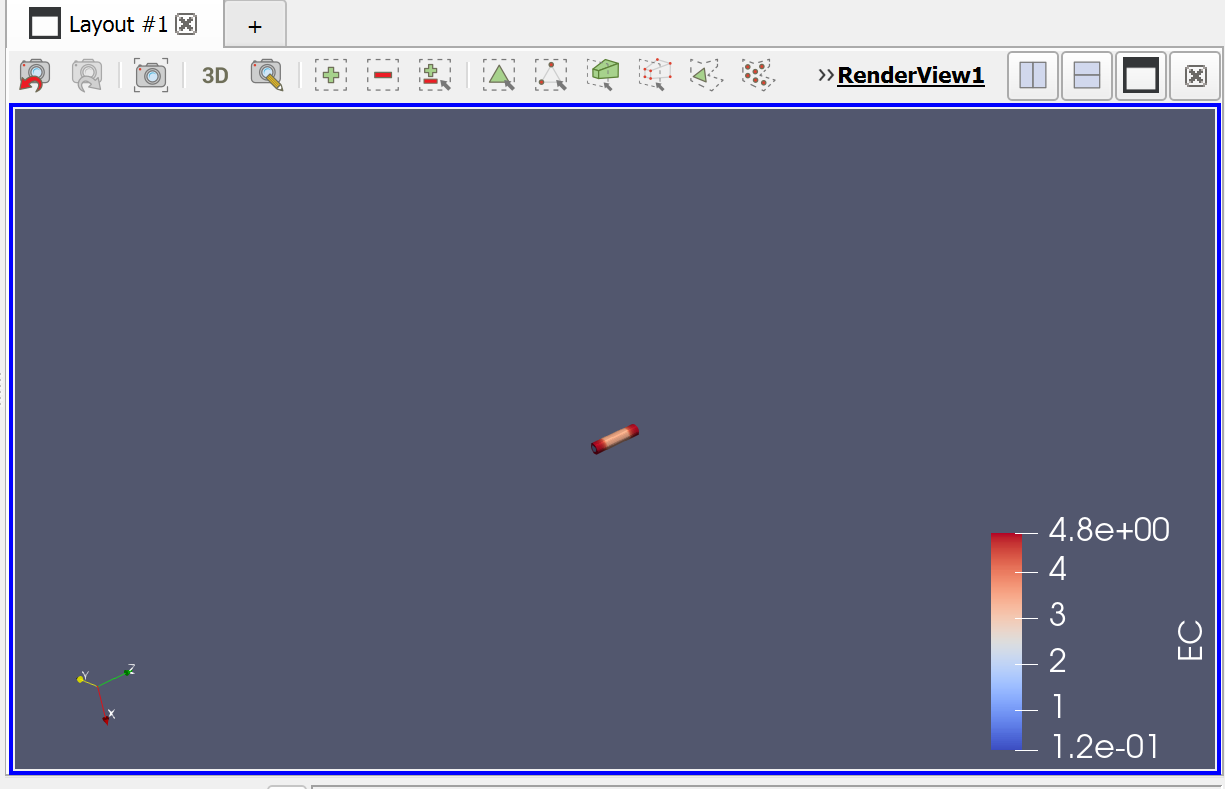
I think the problem is that the model size is too small (on the order of 1e-09). The graphics system handles the values by converting them to single precision, which may be causing the drawing failure.
In the
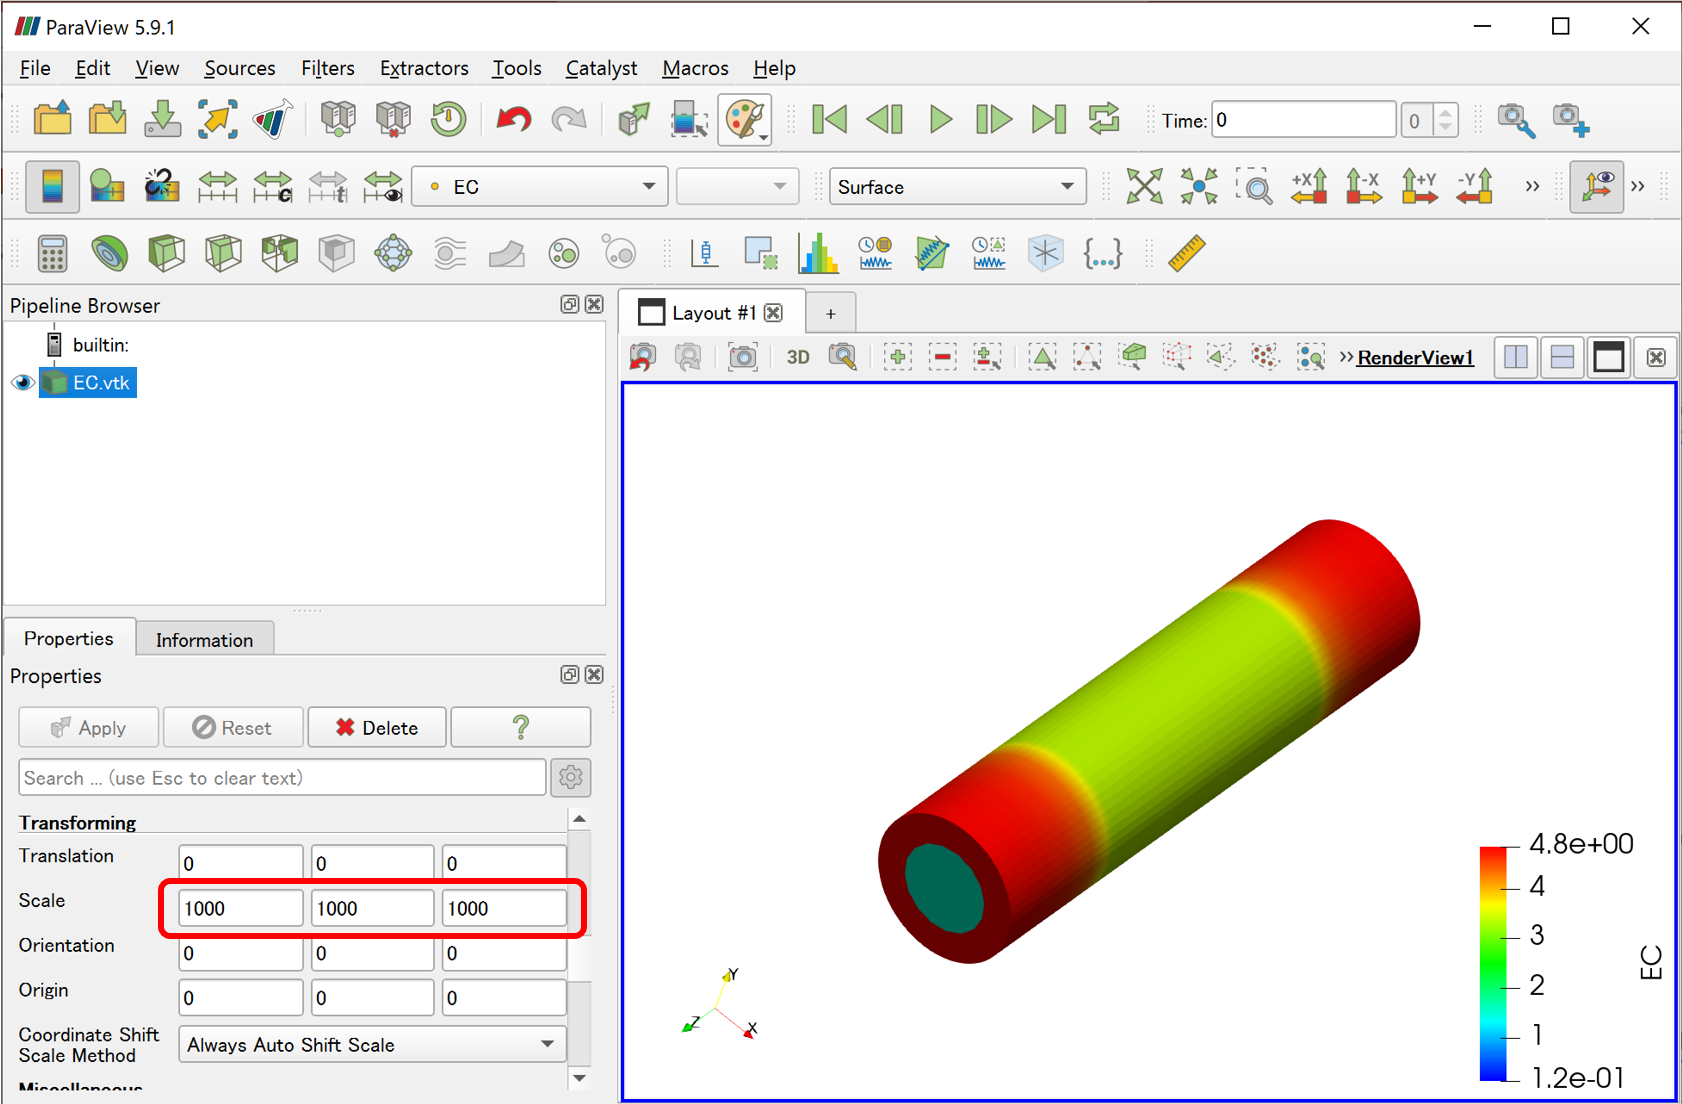
Properties tab > Transforming > Scale
enter 1000 in each direction, and you will see an improvement.
Hmm, ParaView should be doing this scaling automatically. @martink thoughts on why the Coordinate Shift Scale Method wouldn’t work to scale up tiny point coordinate values?