scabo
March 11, 2025, 9:55am
1
Hi. I have some fluent data and i exported them in gold-ensight format and opened in Paraview. But I am getting different contour plots for velocity in Paraview and CFDPost. The one in CFDPost matches with the literature. Is Paraview doing something different or should i need to do something different while plotting the contour? I have attached the result from both-the one with distinct contour patches is CFDPost and is correct.
thanks if someone can provide some help.
mwestphal
March 11, 2025, 11:30am
2
What is wrong with ParaView render ? It looks correct to me, you are just using a difference color map.
scabo
March 11, 2025, 11:46am
3
No, in the CFDPost can you see the distinct semi-circular patches being displayed? I want the same pattern in Paraview be it any color map…
mwestphal
March 11, 2025, 11:47am
4
Are you talking about the isolines ?
Use contour filter to generate them
scabo
March 11, 2025, 11:58am
5
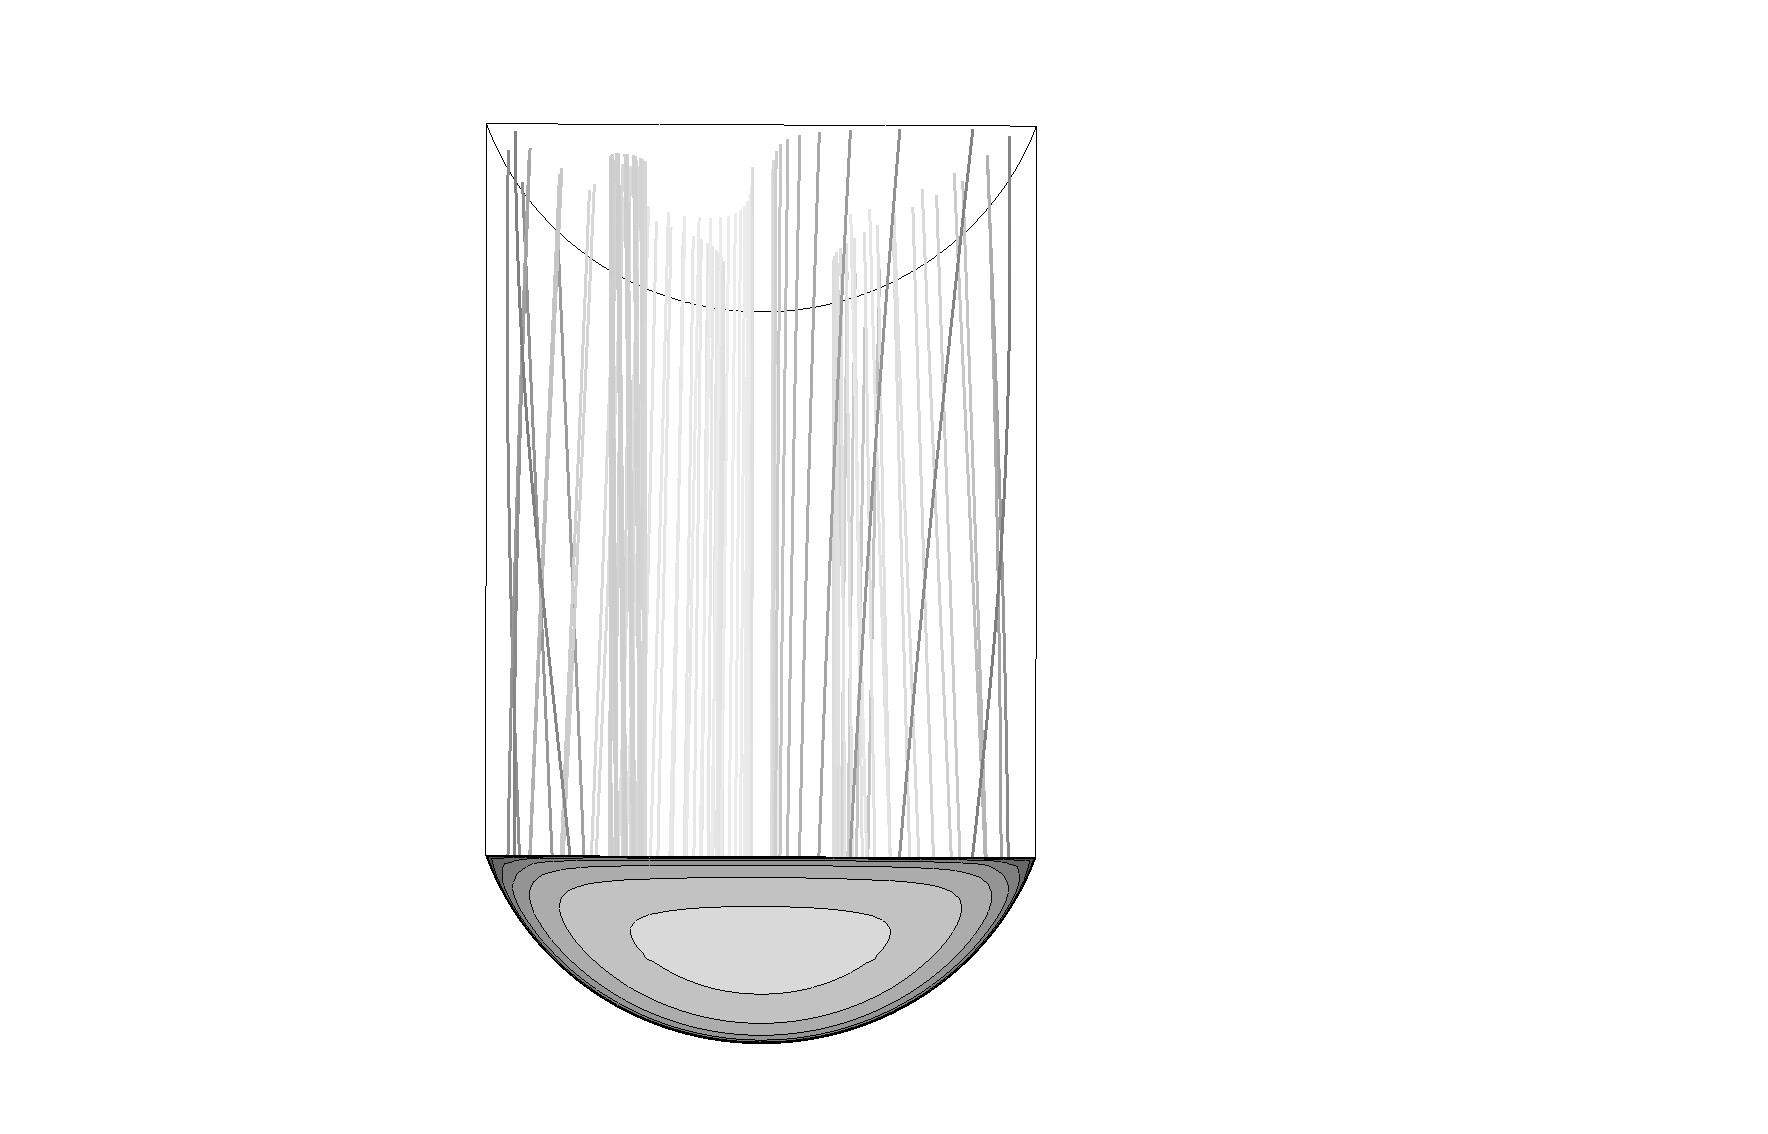
Means if i see the CFDPost, then its diferent from Paraview. See this new attached figure? Or am i not visualising it properly. Without isolines even doesnt it look different?
scabo
March 11, 2025, 12:00pm
6
The new figure is in paraview but grayscale
scabo
March 11, 2025, 12:32pm
9
Hi I am uploading the .dat file but after getting 100% it is showing uploading error. Do you know whats the problem?
mwestphal
March 11, 2025, 1:58pm
10
mwestphal
March 11, 2025, 2:20pm
12
scabo
March 11, 2025, 2:22pm
13
I have just sent it, the .cas and .dat file in a zip (fluent results tho). You may convert to ensight-gold format. or do u need something extra?
mwestphal
March 11, 2025, 2:39pm
14
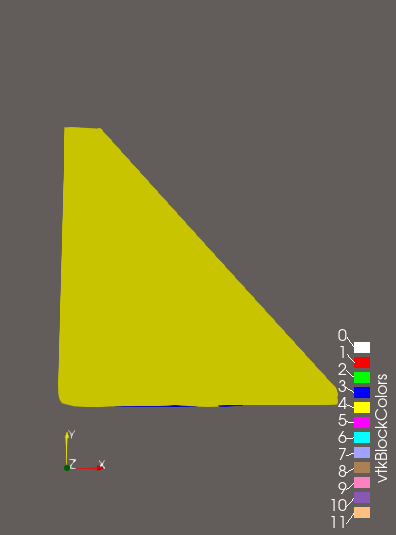
It looks like this when I open the data:
Please share the data you are opening in ParaView. Ensight gold format I suppose.
scabo
March 11, 2025, 2:42pm
15
Hi. I have just sent it a new zip. there please open the .encas file in Paraview, thanks
scabo
March 11, 2025, 3:40pm
16
Hi, did you have a chance to look? thanks
scabo
March 11, 2025, 4:45pm
18
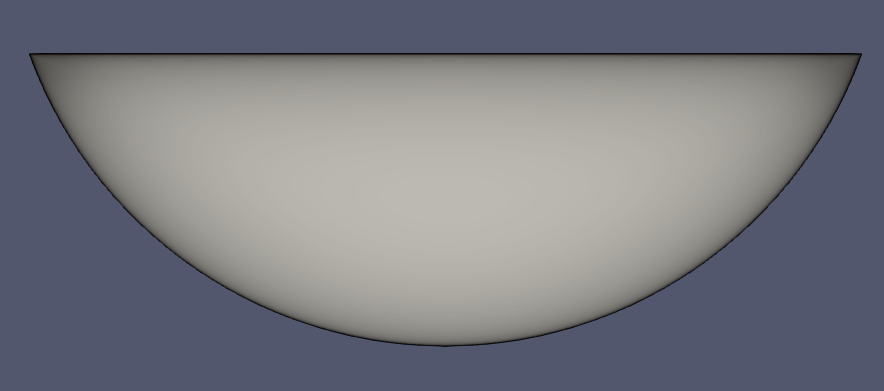
yes, i could not get like this in paraview? How did you do this? thanks
mwestphal
March 11, 2025, 4:48pm
19
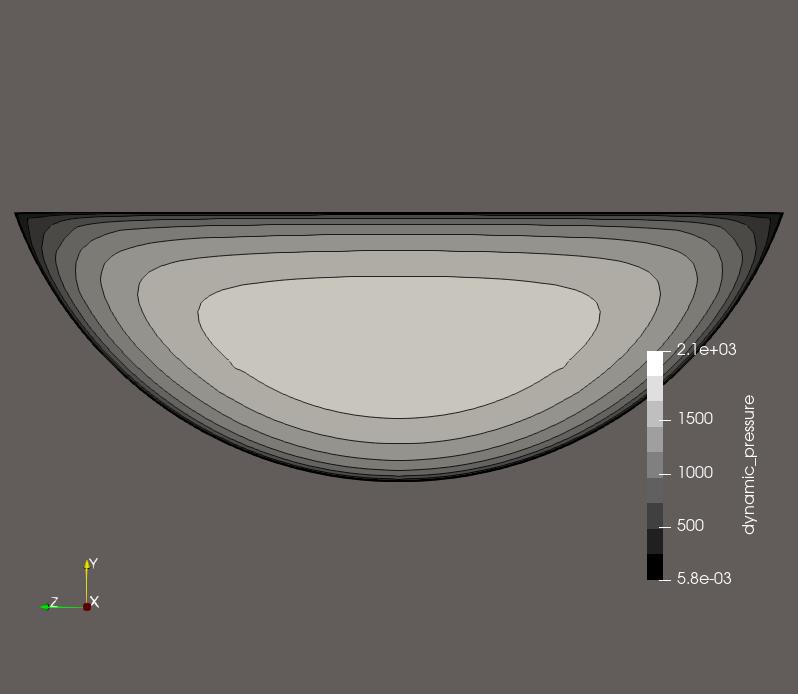
Switch to XRay colormap, invert it
Use Contour filter
Then adapting the “number of colors” to the contours
Did you try loading the state I shared ?