I am using the Resample With Dataset filter to map my flow-field data onto the surface of an aircraft model.
I am also visualising that same data on a X-Z plane, which intersects the aircraft surface. I have noticed that, at some locations, there is a clear discontinuity between the values shown on the plane and the values resampled onto the aircraft surface.
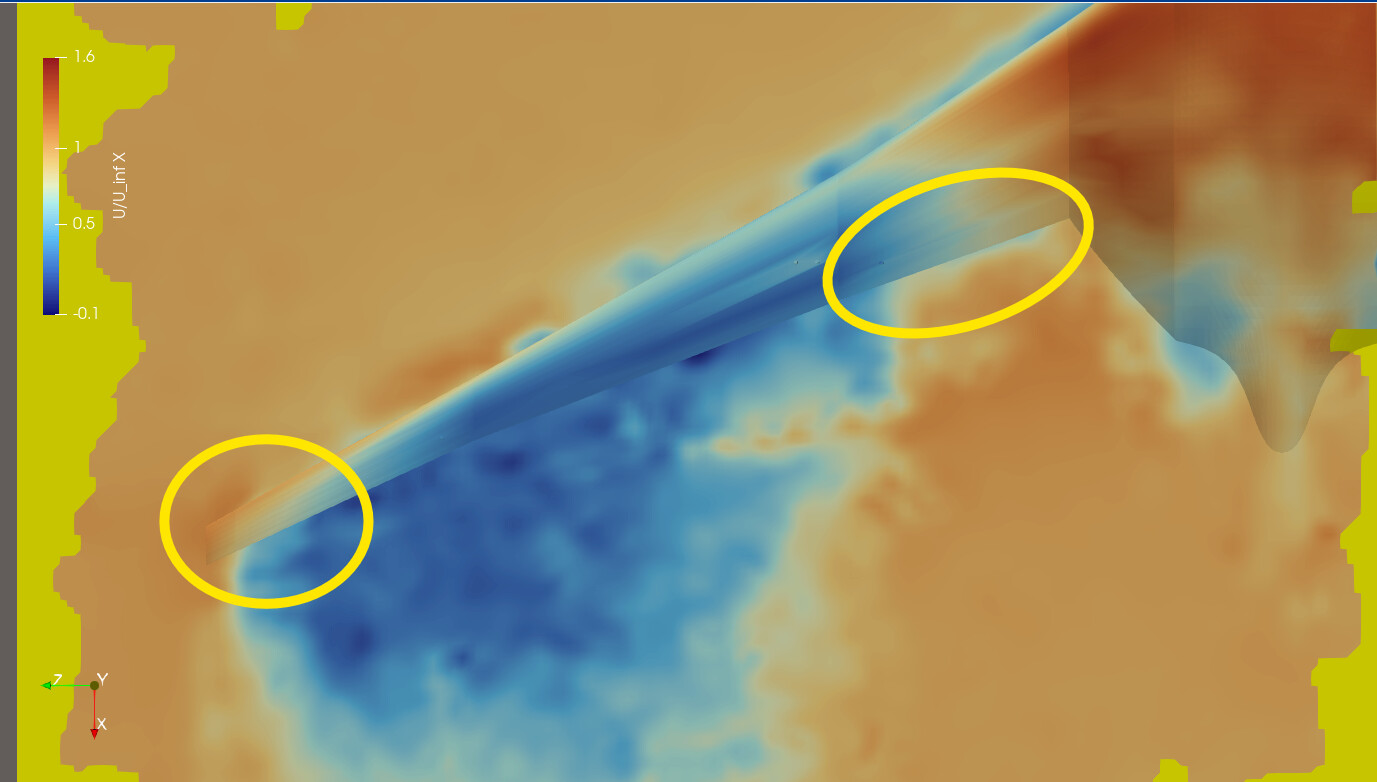
This can be seen in the attached screenshot, particularly at the inboard part of the wing and close to the wingtip. At the intersection between the X-Z plane and the aircraft surface, the colour/value on the plane does not match the colour/value on the resampled surface, producing a visible jump.
Since both visualisations are based on the same underlying dataset and represent the same quantity (U_x/U_inf), I would expect the values to be continuous, or at least very similar, along the intersection between the plane and the aircraft surface.
Could you please advise what could be causing this mismatch? In particular, I would like to understand whether this could be related to the interpolation performed by Resample With Dataset, the point/cell data association, sampling tolerance, or another setting of the filter.
If anyone needs it, I can provide the data and 3D model I’m using.
Thanks in advance!
This is one of those times where @mwestphal would say, “Share your data.” That would be helpful because it is hard to see what is going on in your screenshot.
But to guess at what is going on, it looks like the polygons on your aircraft surface are more sparse than the field-flow grid. Resample With Dataset only samples at the points of the destination mesh (the plane surface). All other values are interpolated between those points. So, if there are a lot of points in the field-flow grid that are not represented by the plane mesh, the data won’t match there.
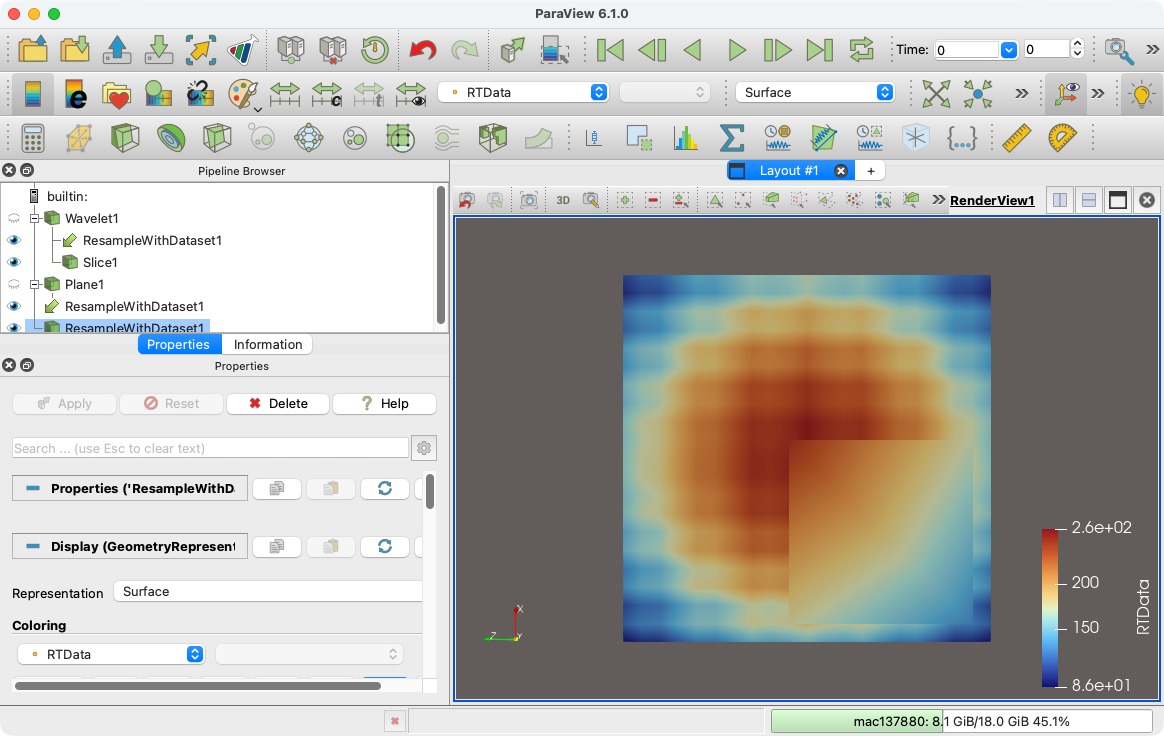
Here is a simpler example I made demonstrating this. This is a Wavelet source that I have resampled with a Plane source with a single quadrilateral. You can see that the colors are correct at the quadrilateral’s corners (where the points in the mesh are), but the interpolation diverges elsewhere.
You might see this more clearly in your data if you render your plane mesh as Surface With Edges. I expect you will find that the colors look correct at the points of the mesh, but the interpolation is off elsewhere.
To make your resampling more accurate, you can add more points to your plane surface mesh. Try applying the Subdivide filter. (You may first need to apply Triangulate as it only operates on triangles.)