Dear all,
I compare different data sets whose data range differs, for instance Data1 values are in the intervall [0;15] and Data2 values in the intervall [0;25].
First, I would like to have both legends on the same intervall, for instance [0;15]. I rescaled the legend such that both views have the same legend range which also worked.
However, the values from Data2 in the intervall [15;25] are depicted in the color associated with the value 15.
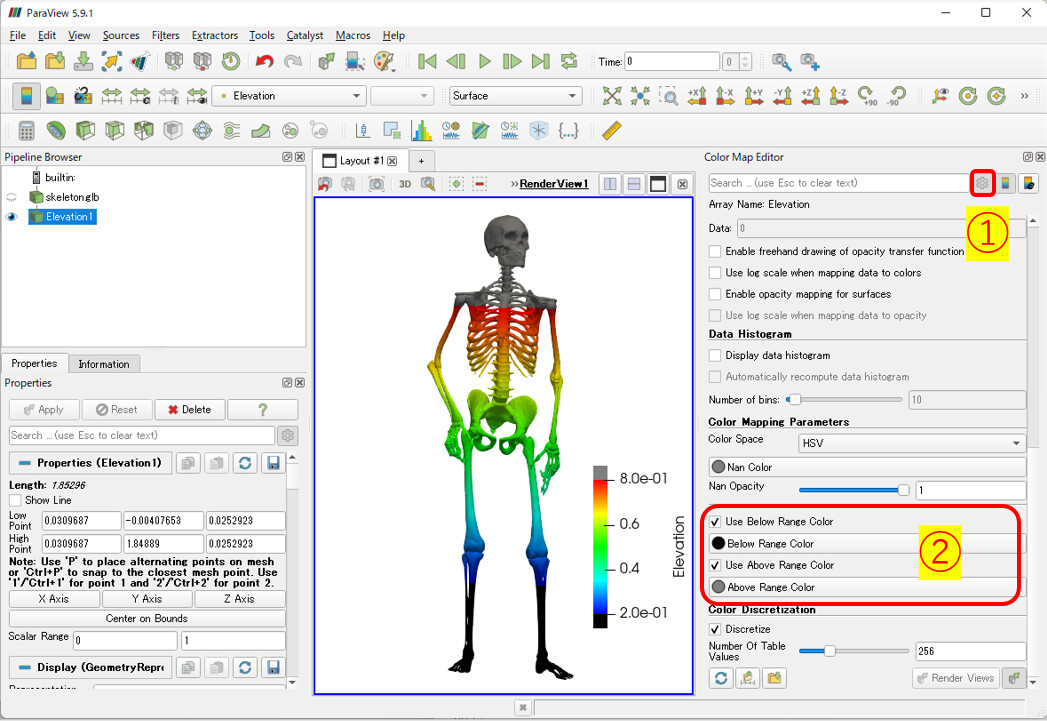
What I would like to achieve is that the values above 15 are depicted in, for instance, grey, in order to indicate that these values are indeed above 15 and not equal to 15.
What is the way to do this in paraview?
Any input is appreciated!
Best