hi, I want to visualize the results of my data which has an X, Y, Z axes with a sphere shape visualization. So, when I display my data with filters “Table to Point” (and I actived the column “keep all data array”) it can only display 3D in the form of a grid of cubes but I want a view that is in the form of 3D with a grid of spheres. so, what should i do to display 3D visuals with a spherical grid (not a cube grid anymore) ? (I really don’t understand using this paraview software)
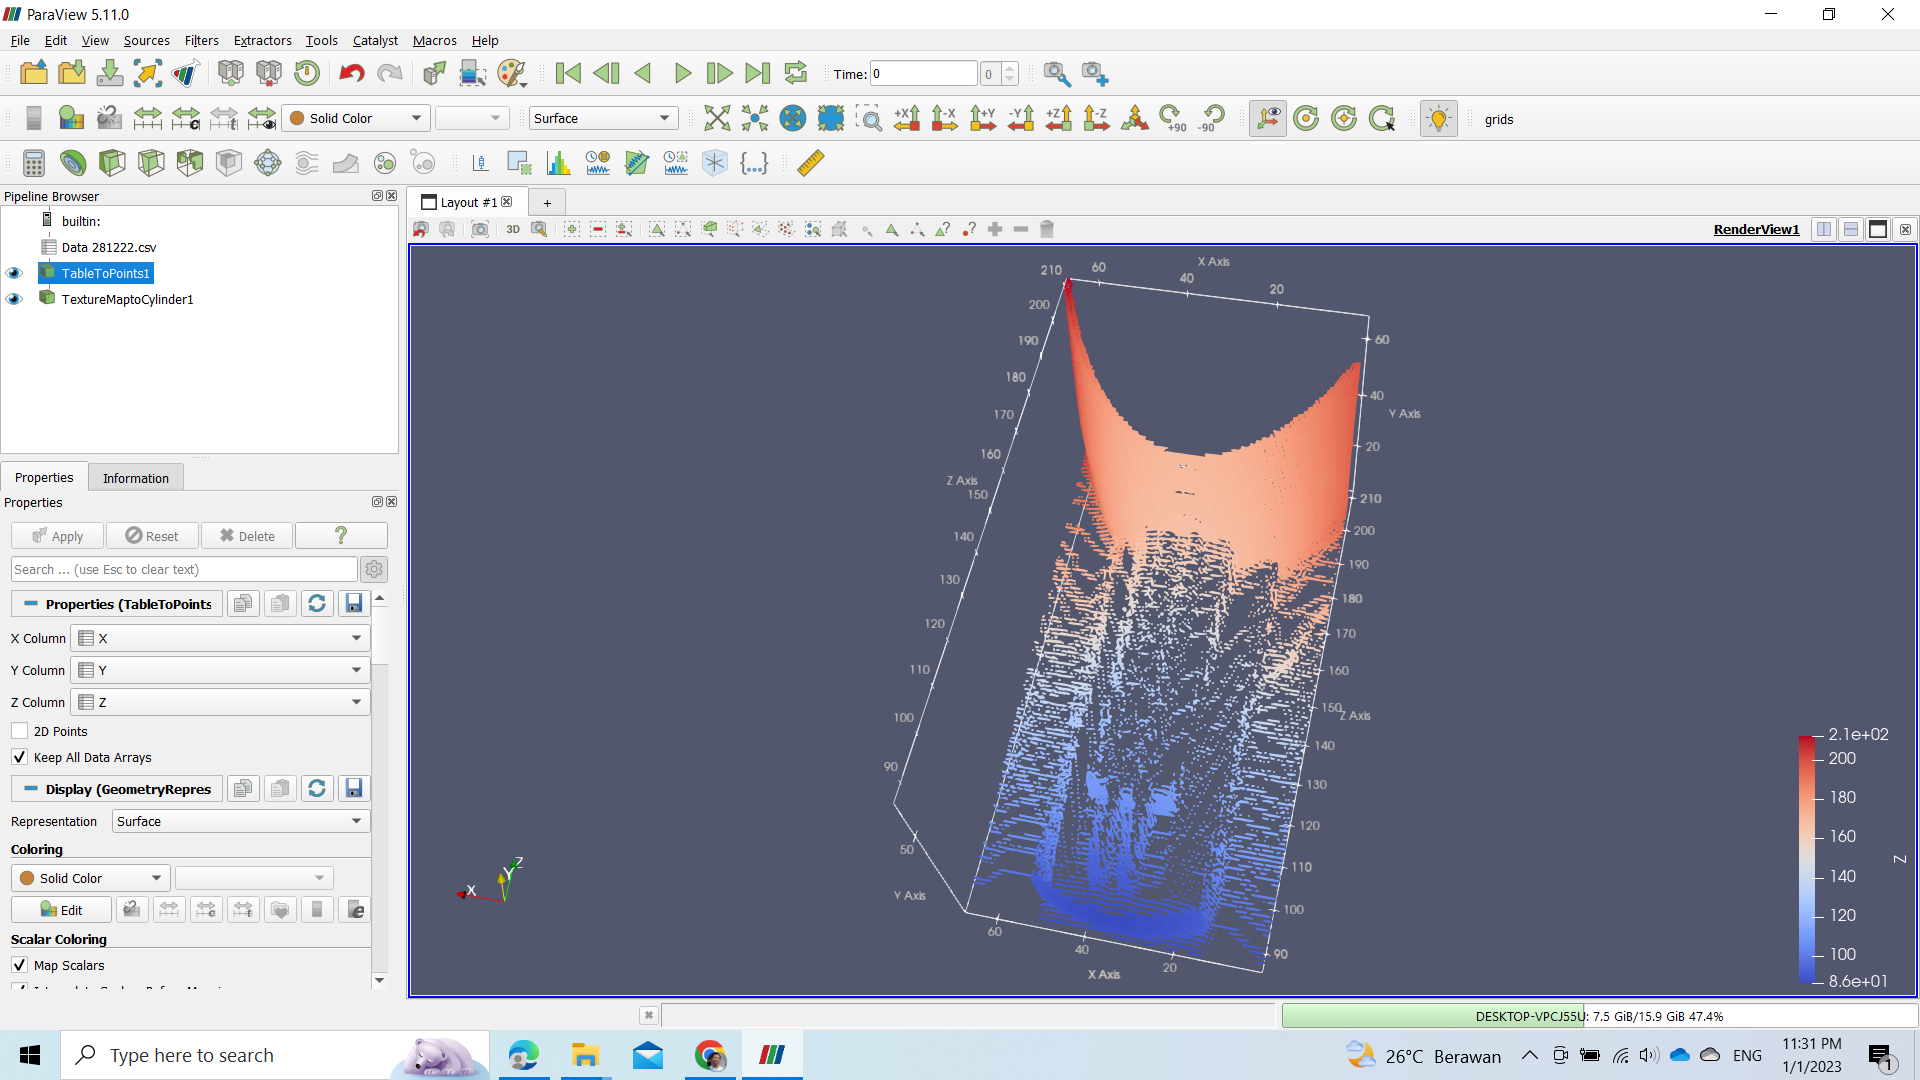
The following is an image which is the result of my 3D visualization in the form of a cube grid after using the “Table to Point” filter (and I activated the column “keep all data array”)
Hello,
first off I do not really know the answer to your problem. It intrigued me because researchers local to me do geotechnical seismic work and your question looked like that sort of data. I think it must be your responsibility to transform the data into a spherical coordinate system because paraview (if it were possible) might only provide points equally spaced and not truly representing the spatial variation of your data. How can it know the metrics for converting from computational rectilinear to spherical coords?