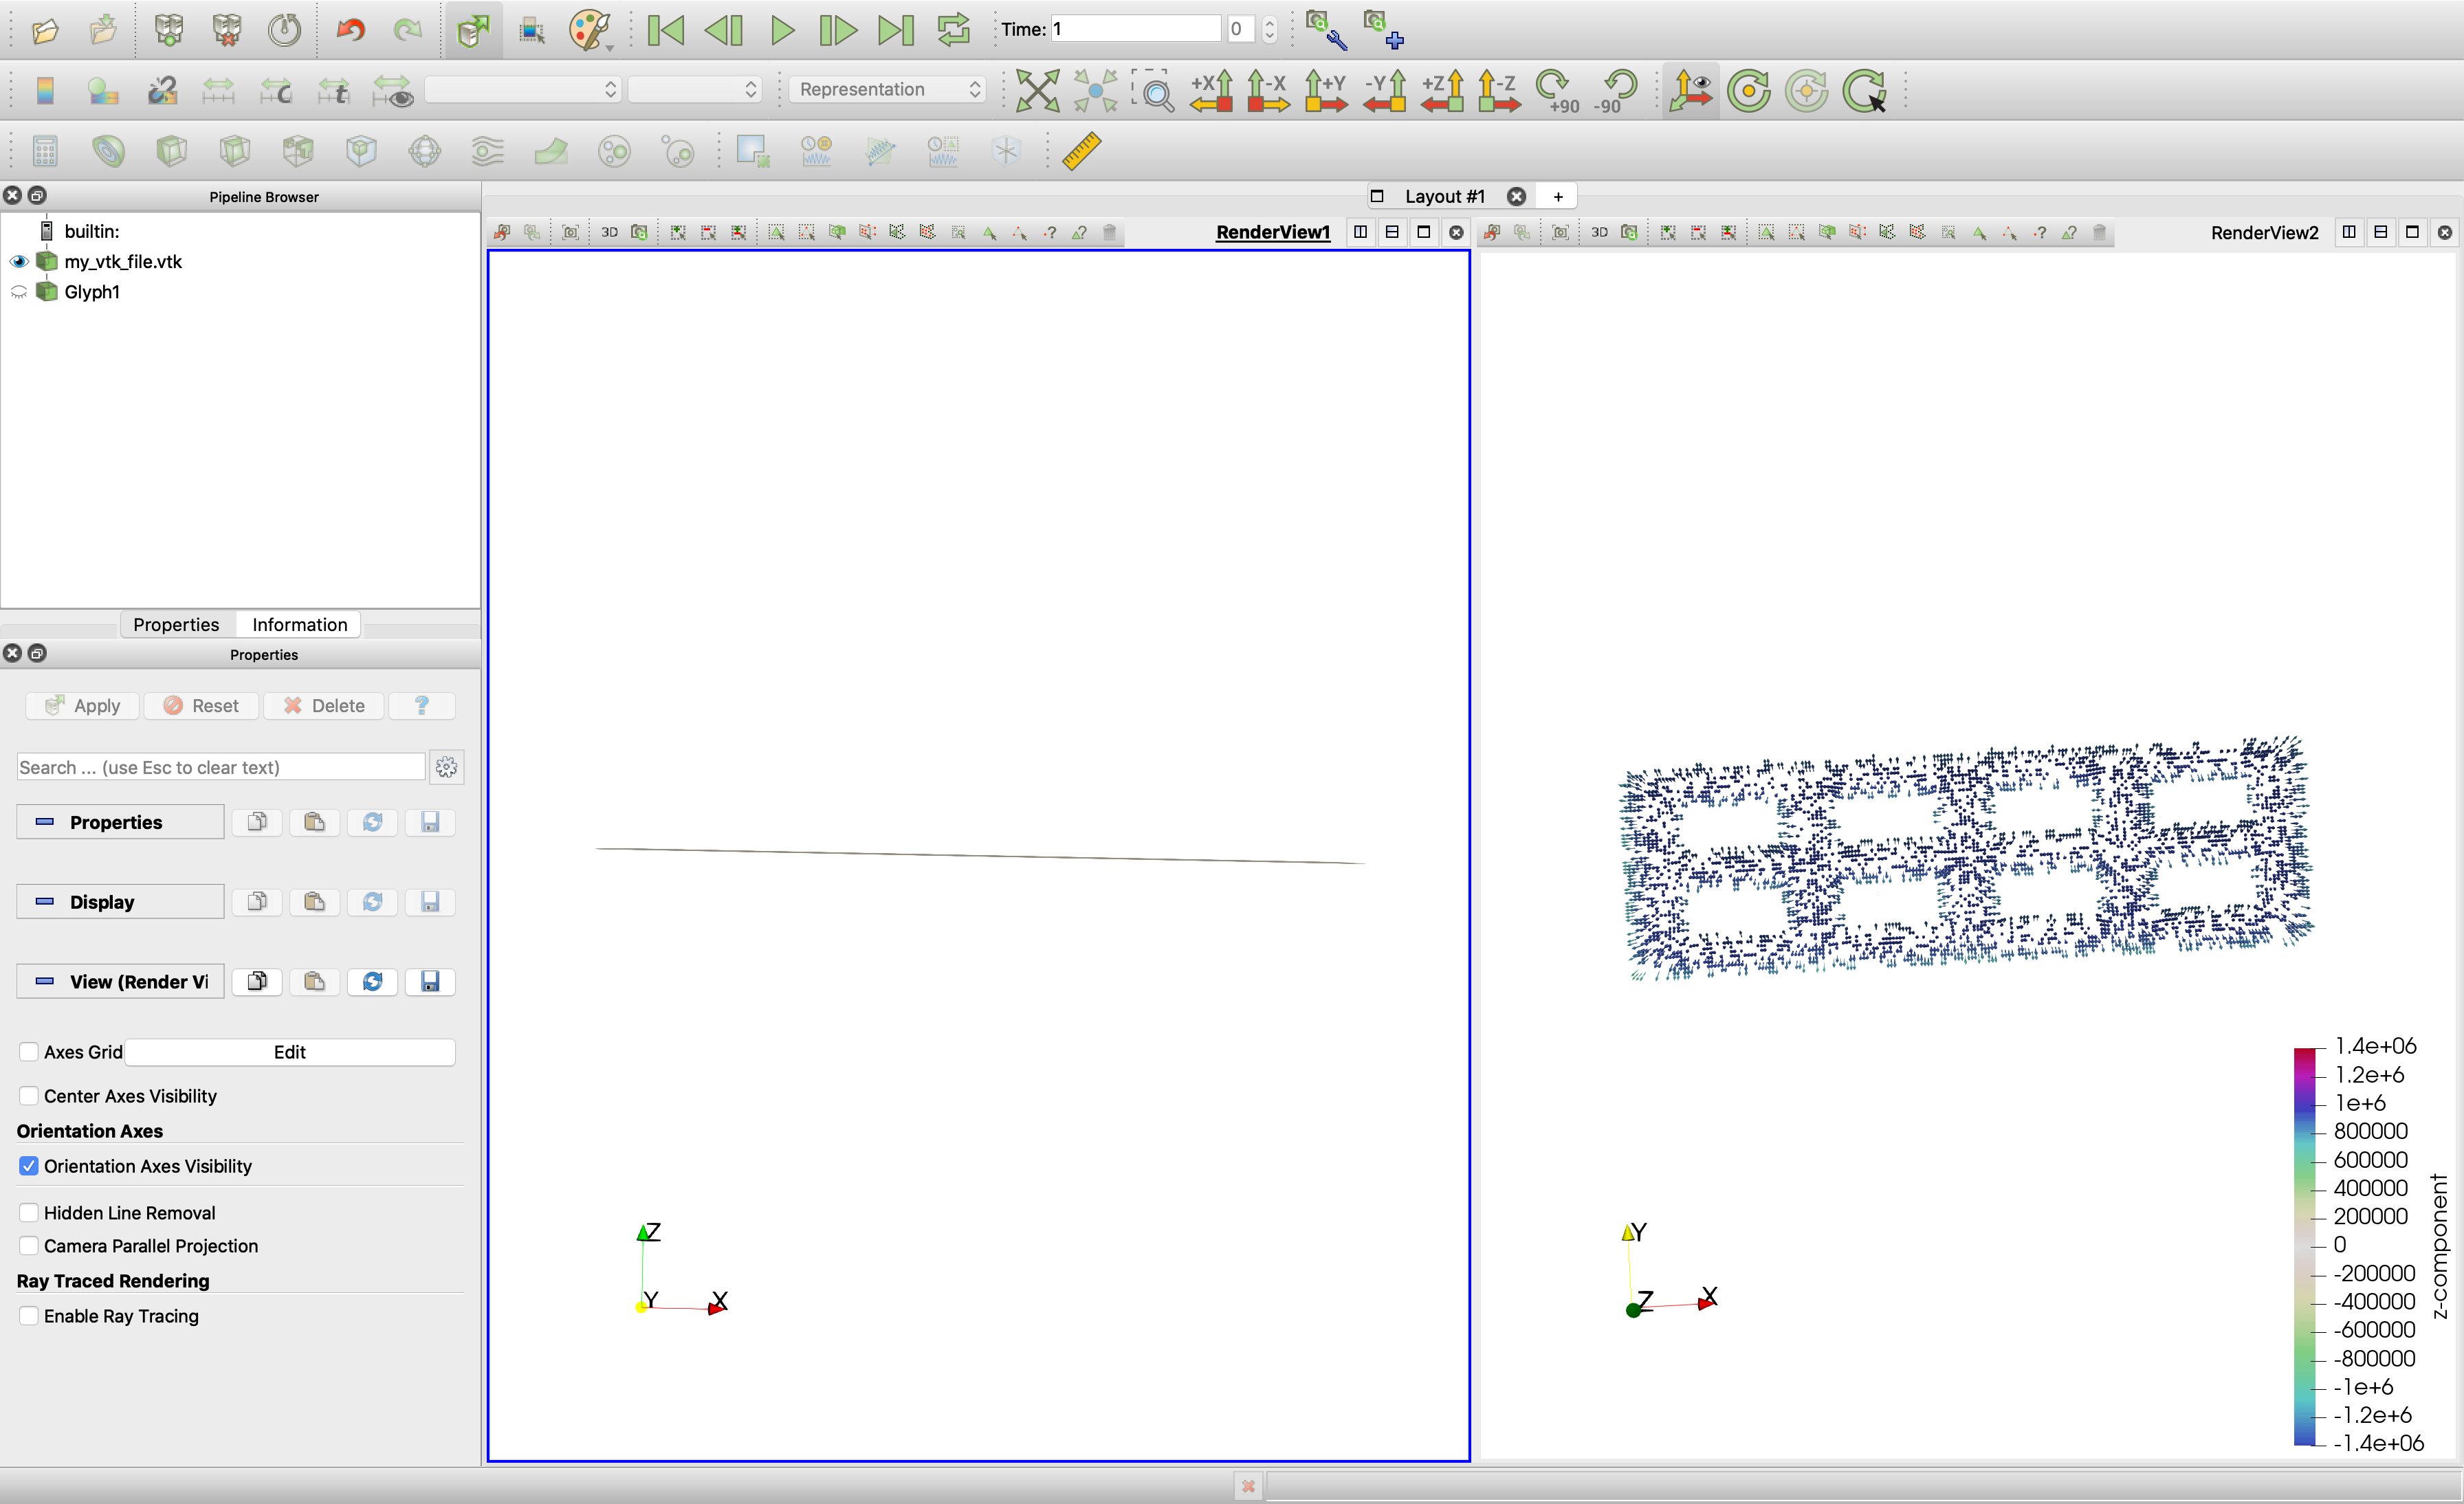
Hello, I am a beginner of paraview, I try to use paraview to open my simulated vtk file, as shown in the figure, I found that I can not see the thickness in the GUI interface of paraview. And I would also like to ask how to match the graph on my left with the vector graph on the right, that is, to get the same gaps as the graphics on the right in solid color, which I got in the simulation.
I am using the release version of paraview 5.7, the operating system is Macos 10.15, I attach my vtk file below, thank you very much for your help! my_vtk_file.vtk (953.2 KB)
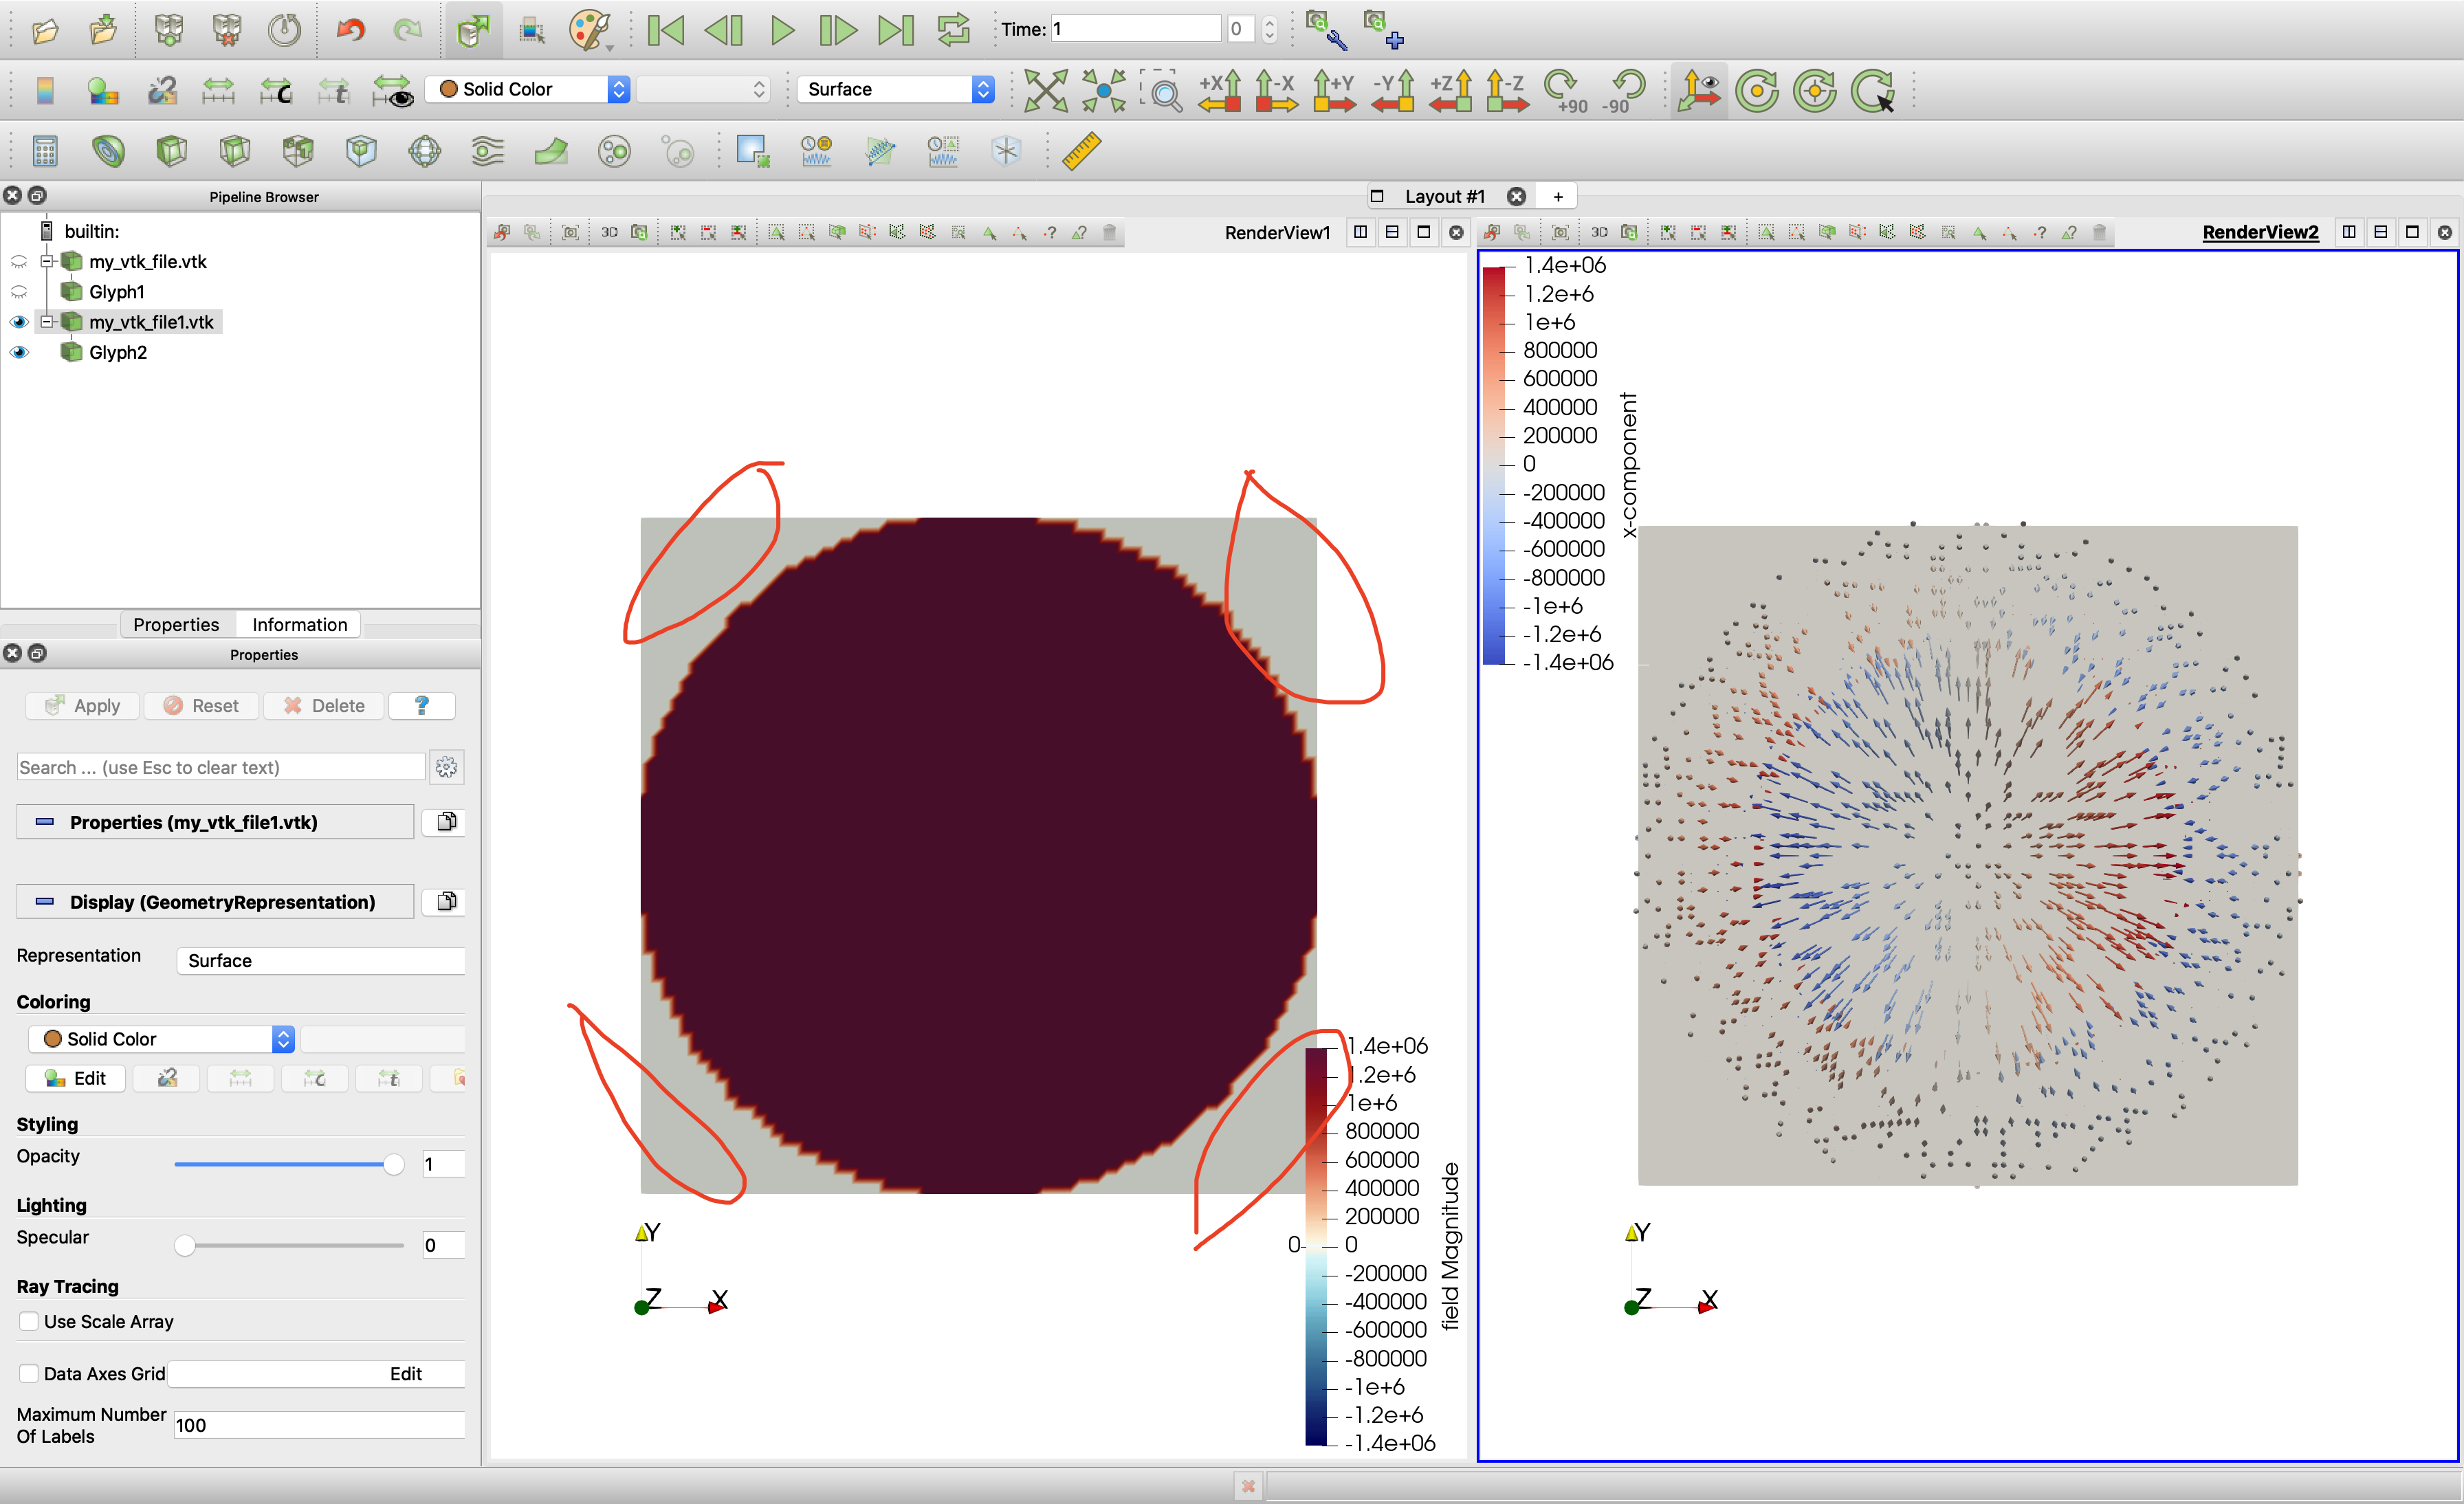
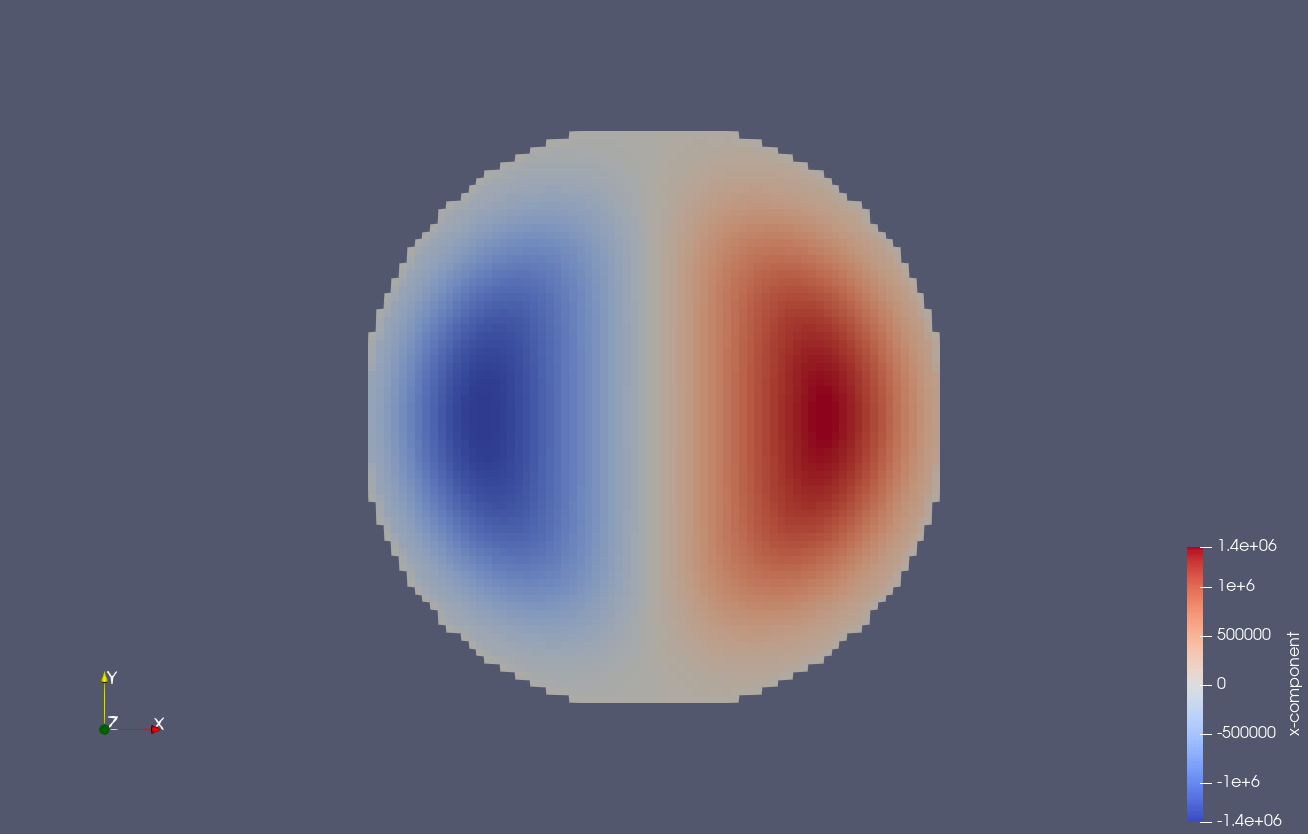
@mwestphal ,Thank you very much for your help. I think this may be because I set up only one layer of mesh in the finite difference simulation. If possible, I would also like to ask you how to remove the part shown in the red circle in the following picture. I just want to get a part of the disc. I set the saturation magnetization of the disc in the simulation. I try to change the setting of colorbar, but although I set 0 to white, the color in the image is not white. Can you tell me how to remove the place where it is written in the red circle? Thank you again for your patient help!