I’m trying to draw isolines (just the lines not filled) of some CFD data that I read from a series of VTK legacy ASCII files. The files load OK and I can view the mesh and the default color-filled images just fine. The problem is no matter how may times I try to use the Contour filter to generate isolines, whenever I hit apply all I get is the gray background screen and no images. The data is unstructured 2D (triangles with data stored at vertices). Obviously, I’m doing something wrong but I can’t figure out what it is. I tried everything I could find in the way of how to do this on the Net but still no joy. Can some one send be a step by step instruction on how to do this (no state files etc because those are no use to me). I’m using PV 5.8 on a Linux X86-64 system running Linux Mint 18.3
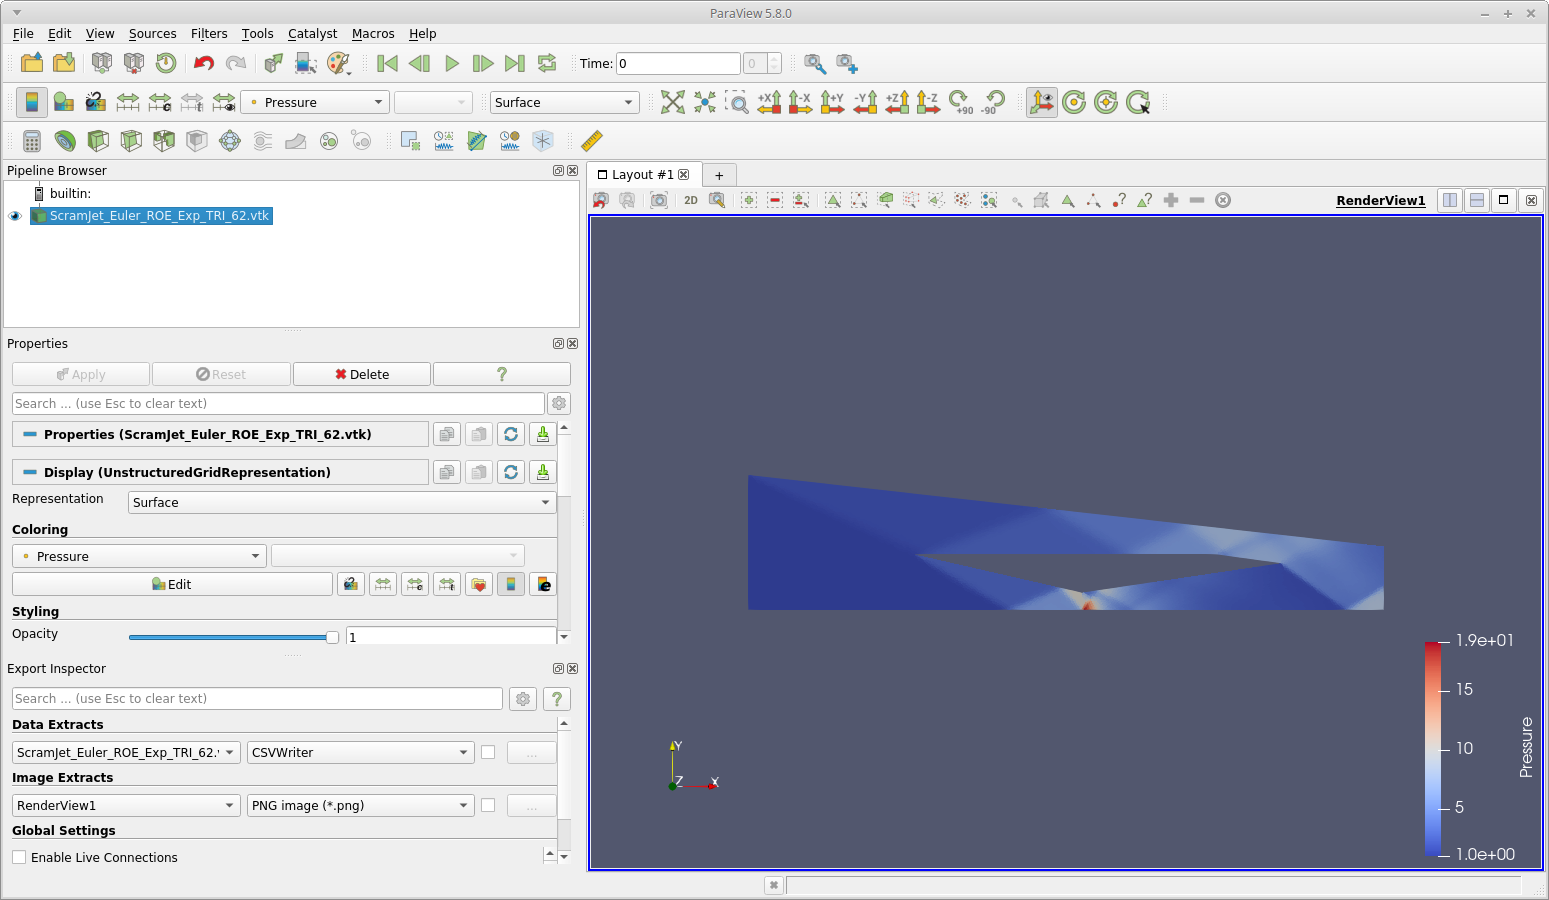
an image of the intial view (pressure) when I load the VTK file
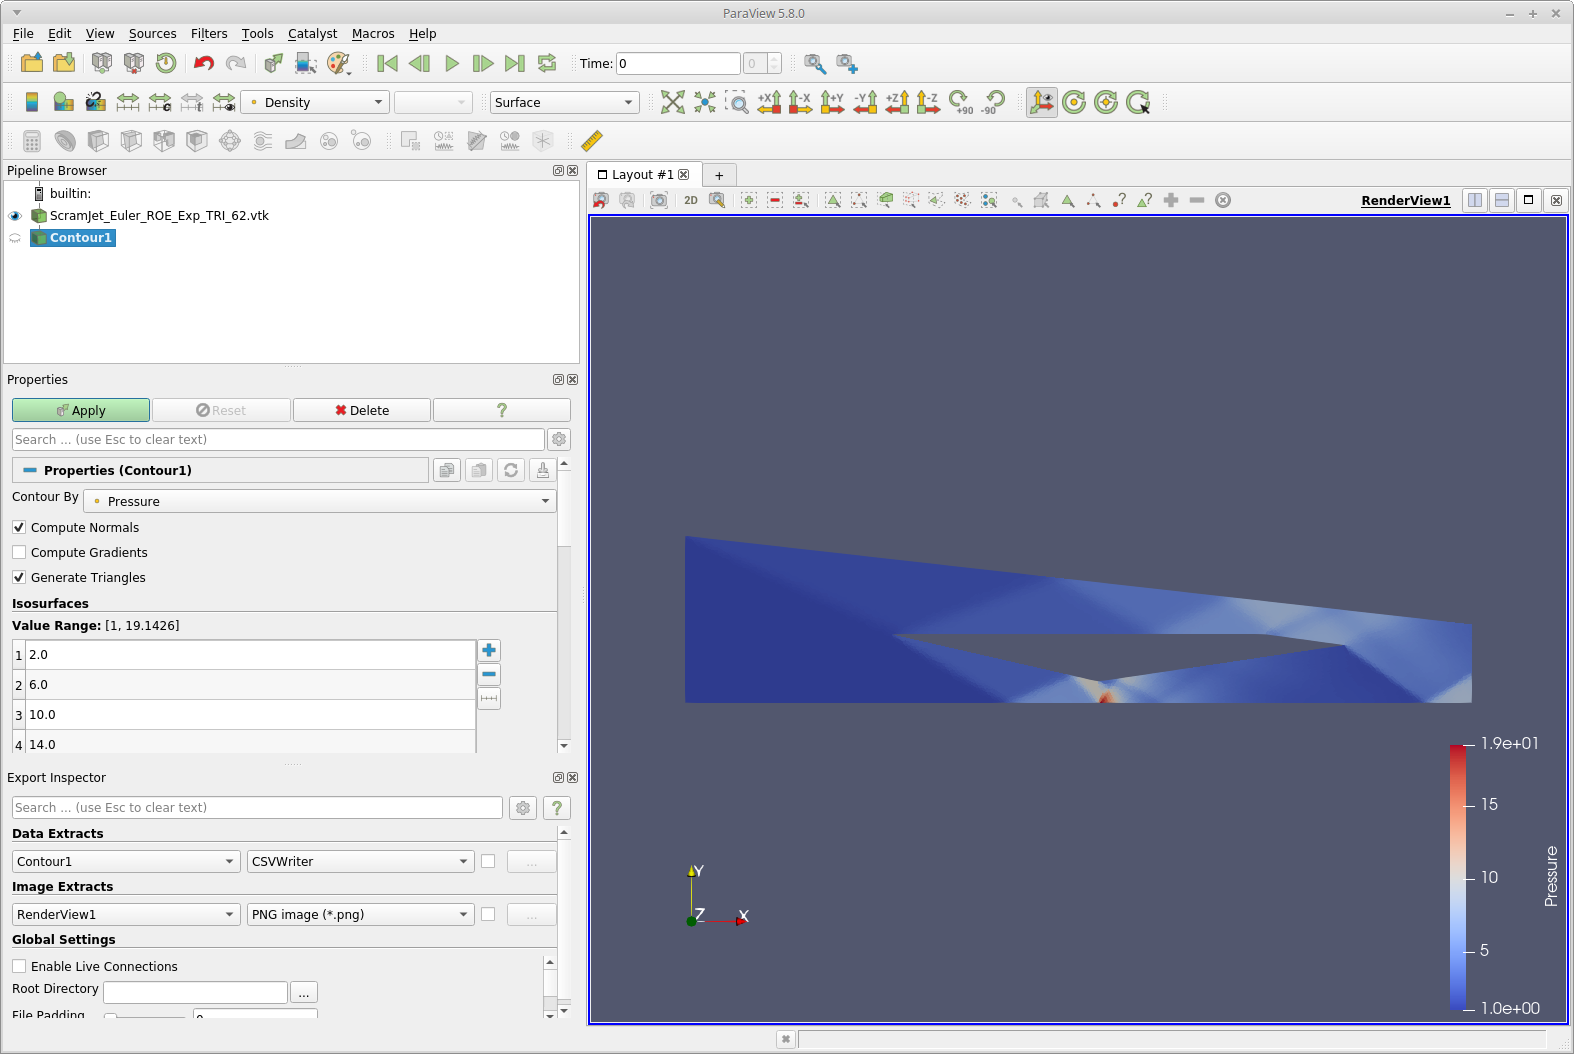
an image of how I set up contours before hitting APPLY. The pressure ranges from 1 to 19 so for a first try I specified isosurfaces at 2, 6, 10, 14, and 18
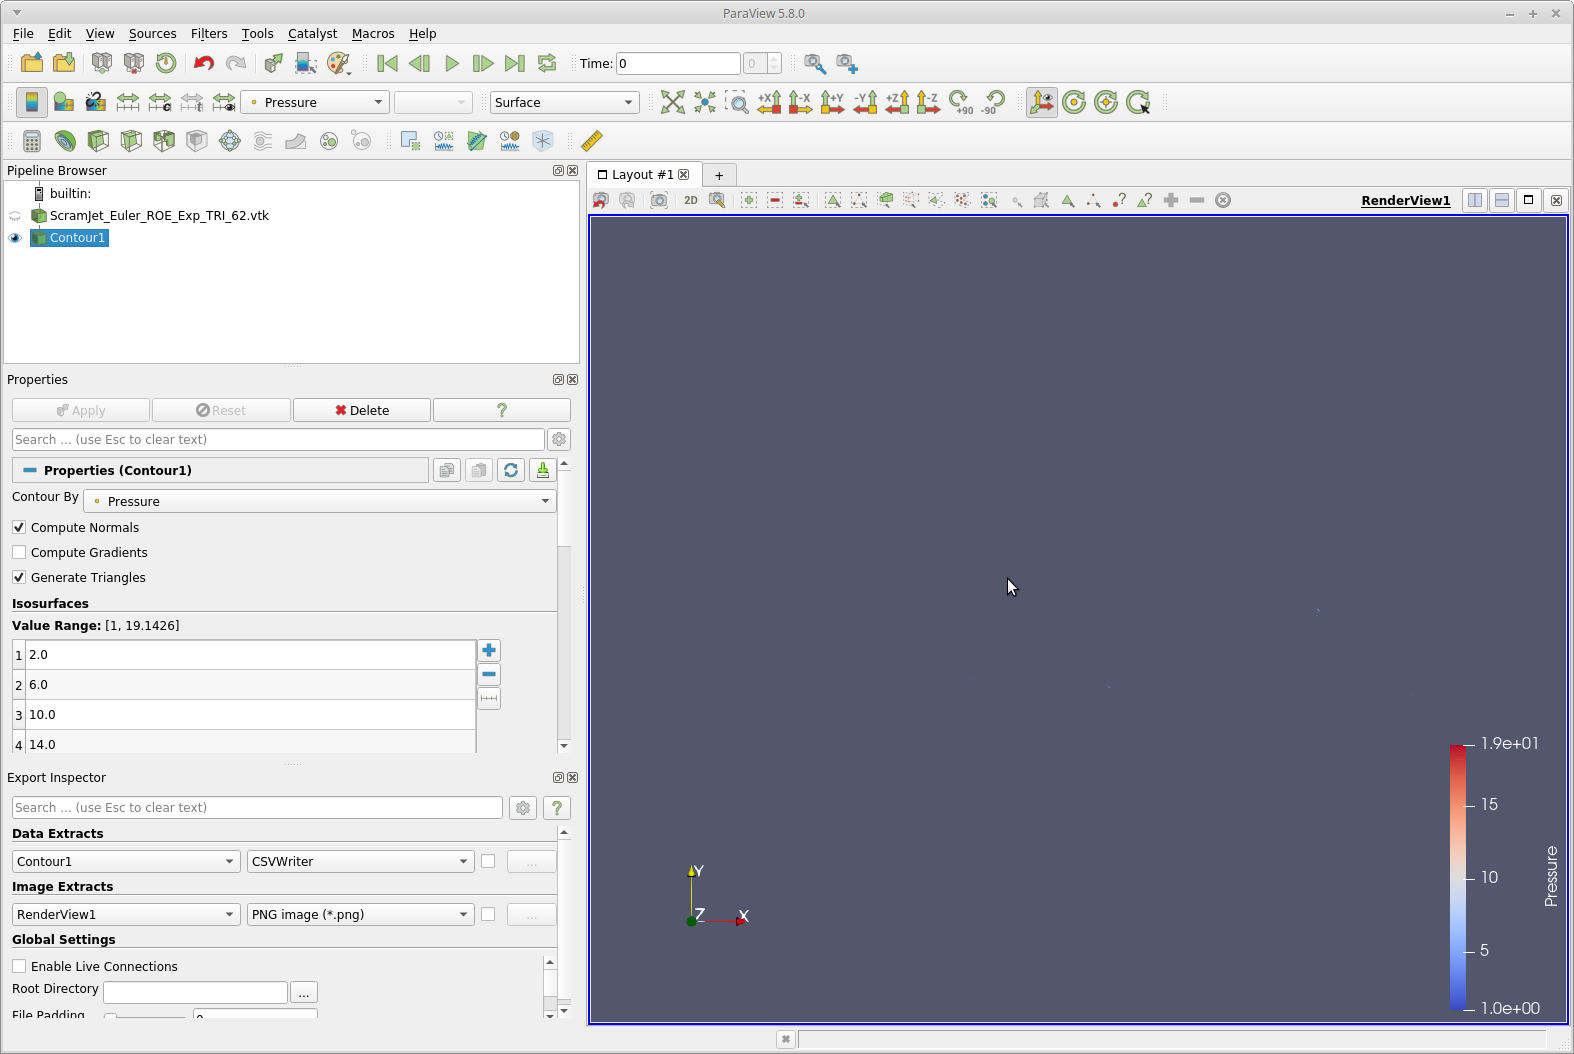
an image of after I hit APPLY and get nothing but a gray screen with a color bar.
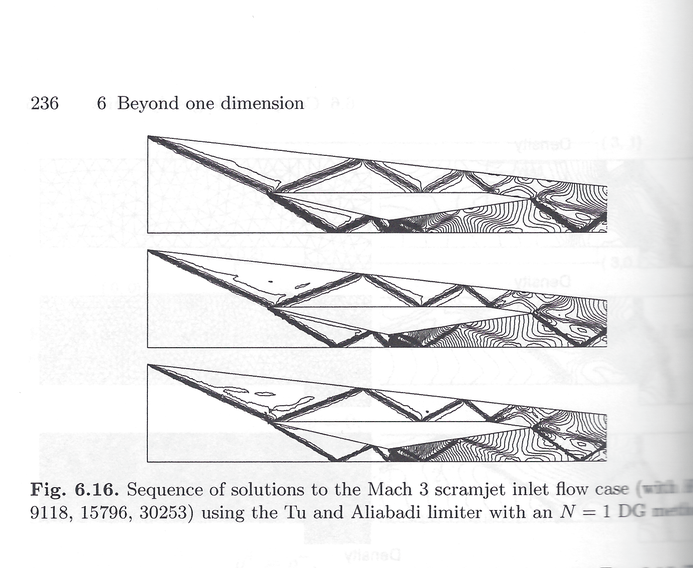
I’m trying to match an image taken from a book (Hestahaven and Warburton’s Nodal DG book). I’ve attached a scan of that image.
The VTK file for the last of the time step from my sim. I’ve gzipped it down to 3 meg. It’s an ASCII VTK legacy file and should contain just density and pressure data along with the mesh. Each value is stored as a VTK scalar point quantity.
More info about my system. I’m using the MATE desktop version of Linux Mint in case its a QT (i assume you are using QT) or other library issue.
Again, I’m probably doing something wrong but I can’t figure out what. I’m guessing I’m doing steps in the wrong sequence or missing something I should be doing
Thanks Mathieu. I was aware of the connectivity problem. That’s a by product of the interpolation scheme I adopted from another code that trys to interpolate the DG solution point data that are internal to a cell (and also on the cell edges for Lobatto points) and are usually at Guass points to points that are evenly spaced in a triangle and generate a dual mesh such that the interpolated points are become values at the vertices of the dual mesh. My other option is to try to interpolate data to common vertices on the existig mesh and then average the data from each cell to remove multiple values defined for a vertex. However, I felt that was a more complicated approach to what the code I borrowed does. I thought I tried clean to grid and it didn’t work but thats again probably an operator error on my part