Hello all,
Apologies if this question has been asked before; I’m new to this software/site and I’m not much of a programmer.
I’ve generated a VTK shape model embedded with 3D vector data at every vertex (via SlicerSALT and the “Model to Model Distance” module) that describes the point-to-point distances between two shape models. I’d like to display color-coded vectors in a manner similar to diffusion tensor imaging, where medial-lateral fibers (vectors, in my case) are colored red, anterior-posterior is green, and superior-inferior is blue.
Is there a way I can create or modify a color map that colors the vectors according to their direction in each axis? For example, a vector that lies only in the x-axis (medial-lateral) would have an RGB code of (1,0,0) and be colored red, but a vector that lies in the x and z axes would have more of a purple color since it’s a mix of red and blue. The colors would be along a gradient in the RBG color spectrum according to how much in each direction they lie.
I’m able to decompose each vector into their x, y, and z components using the calculator filter and display/color them separately as individual glyph filters, but not in the manner I described above. I hope I made sense–any help is appreciated!
Thanks,
KVM
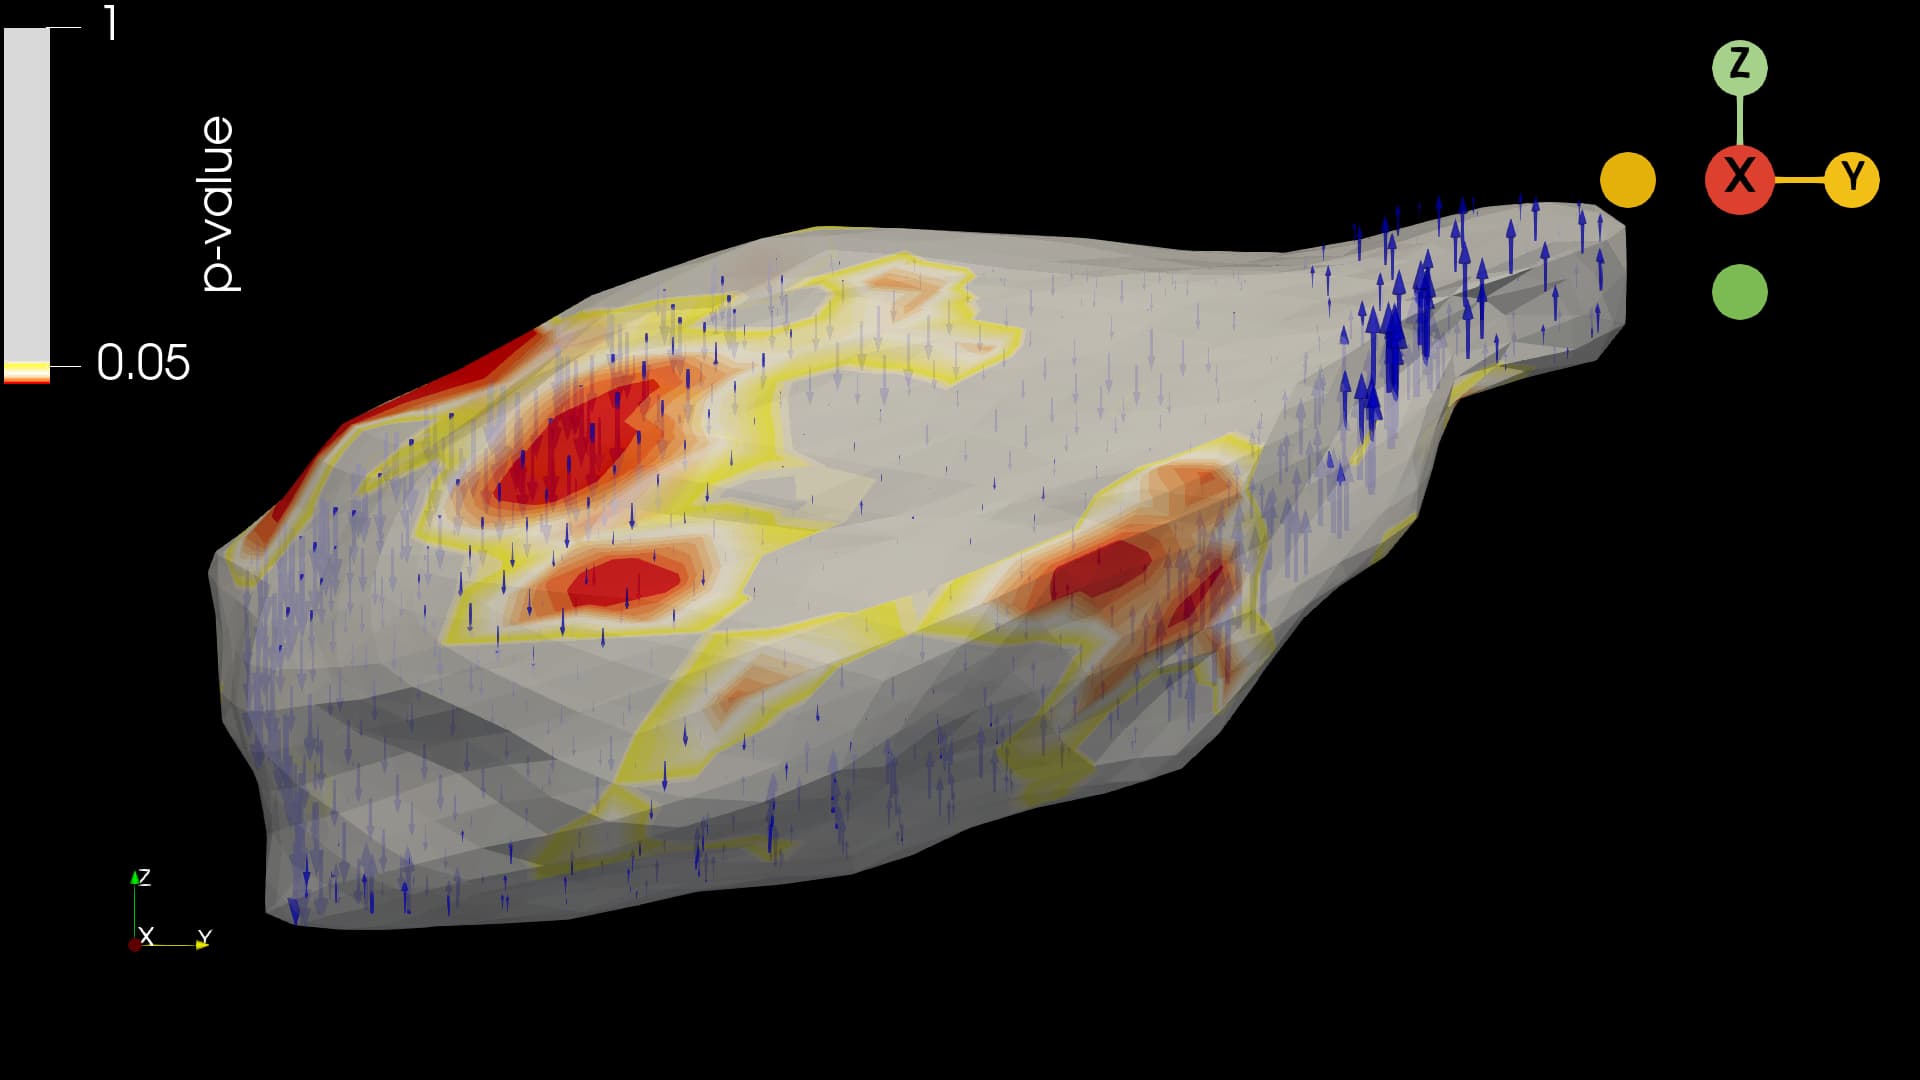
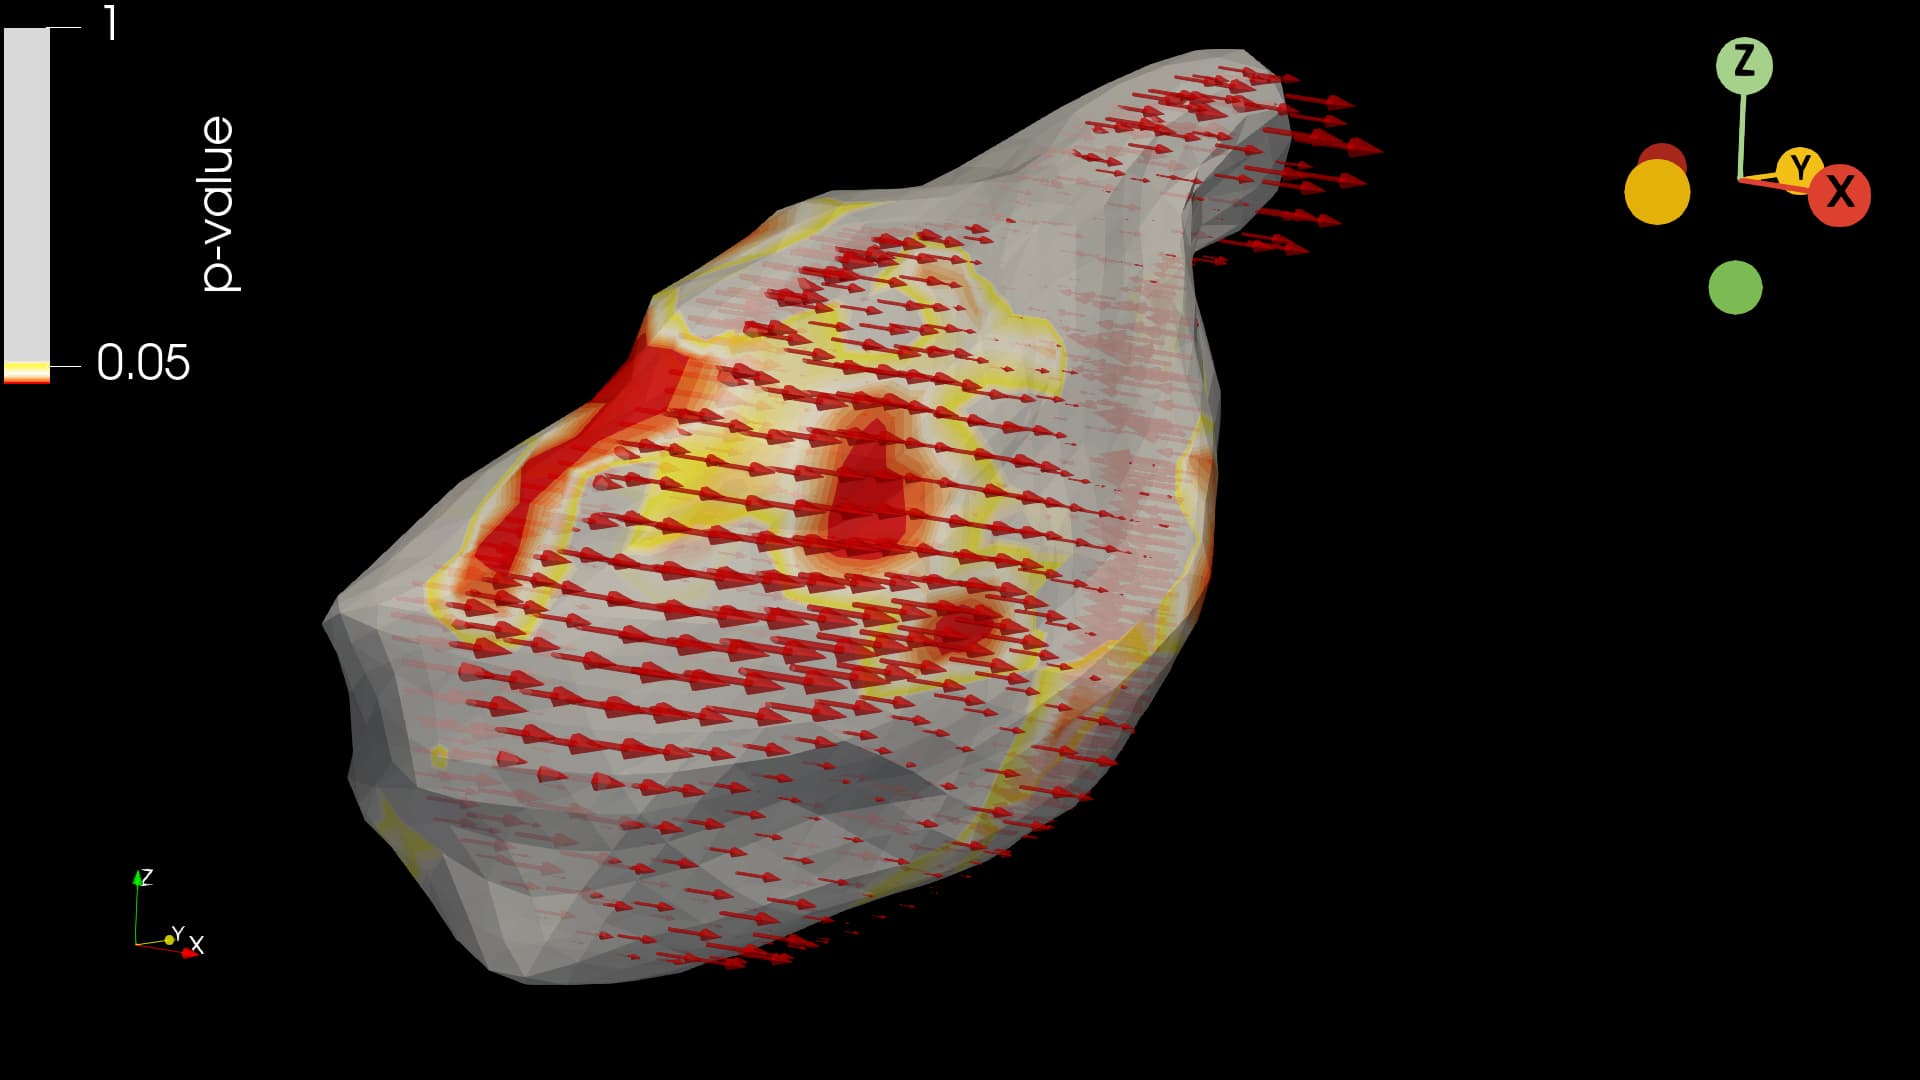
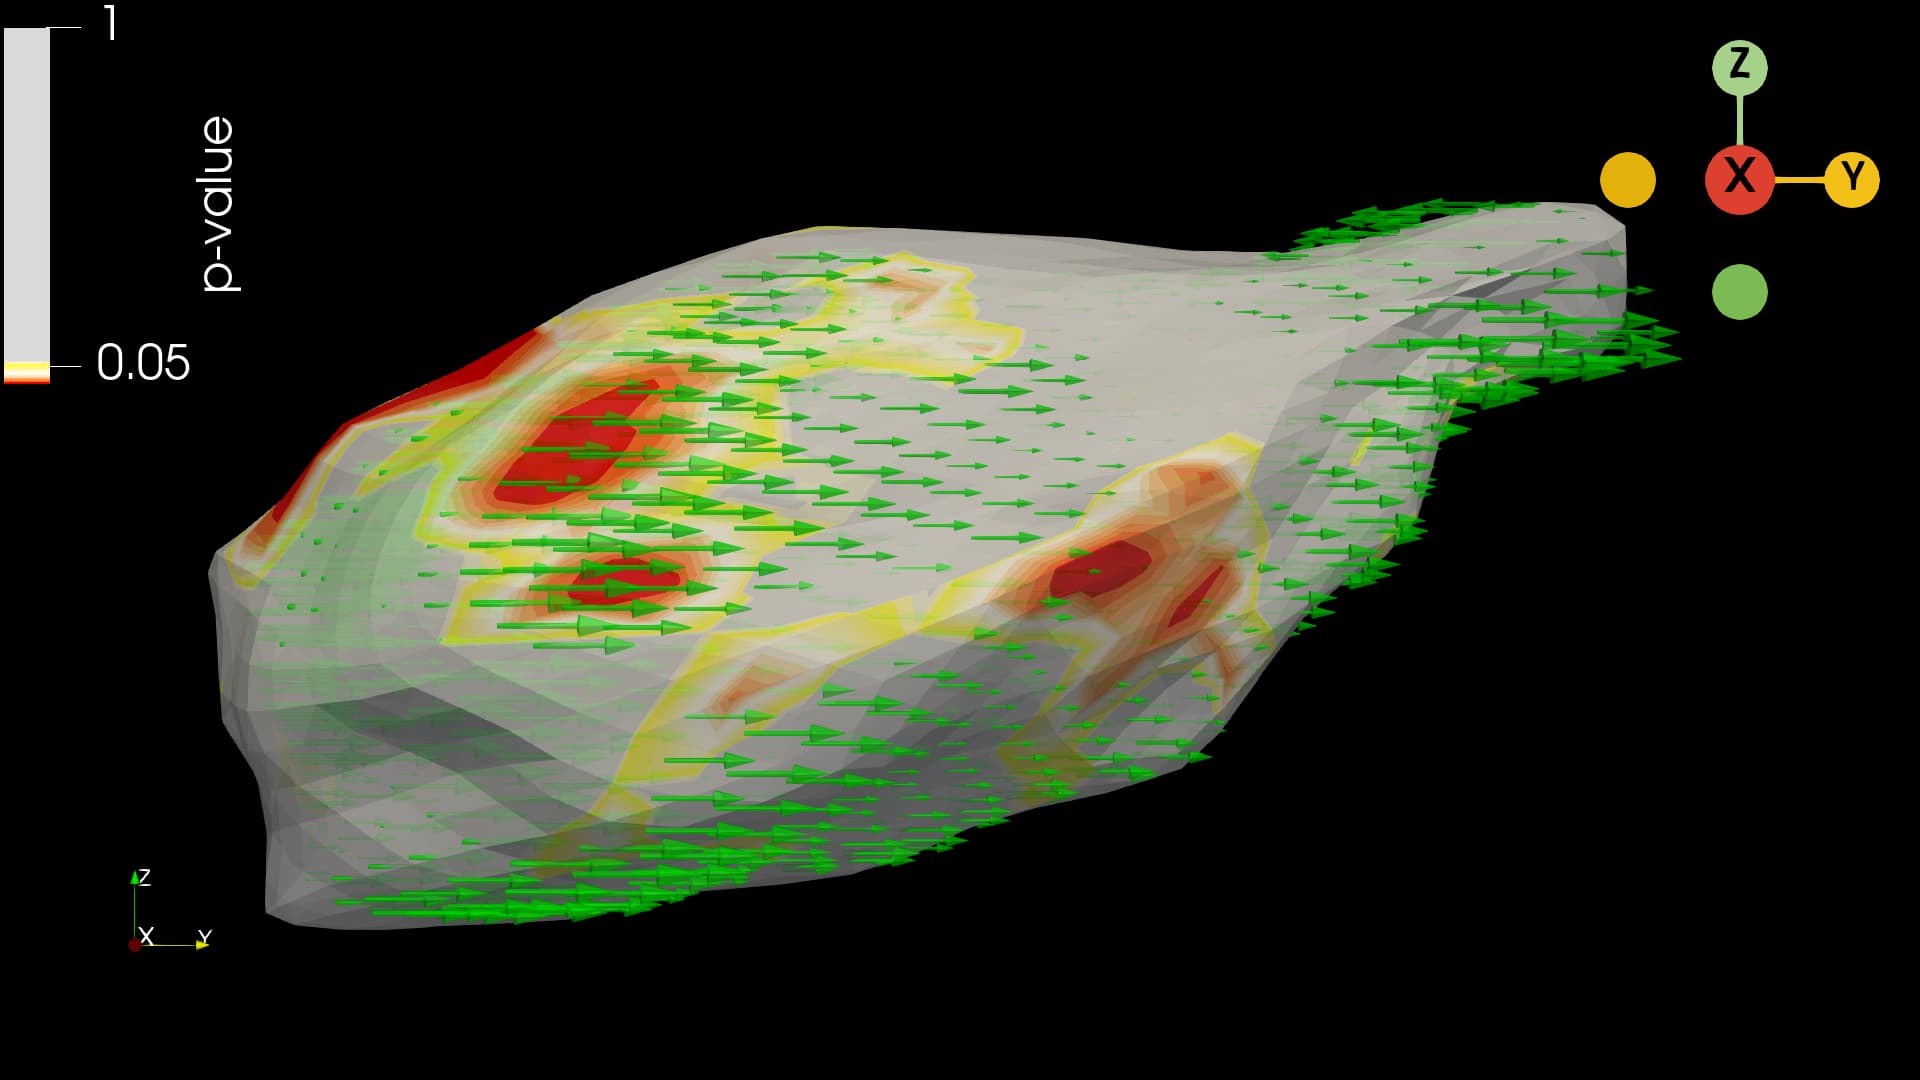
Edit: Here are screenshots of the decomposed vectors that I have so far; the goal is to have the resolved (x+y+z) vectors colored according to how much in the x, y, and z axes they lay.
X-axis:
Y-axis:
Z-axis: