I just installed the latest version of paraview, 5.6.0 64-bit, on my laptop. I want to visualize the results of my FE simulation given the attached vtk file. plotsUnDeformedConfiguration_phasefield_10.zip (1.2 MB)
I would like to visualize my scalar field (called phasefield in the file) using “feature edge” representation. I am struggling to change the color of the edges. No matter what color I choose in edge --> edge styling, the edge color does not change. I appreciate if you can help me with this
I can see how the name of those controls are confusing, but you do not use the Edge Styling controls when using the Feature Edges representation. (Those controls are only for representations that show both edges and something else at the same time.)
Instead, use the controls in the Coloring section. These controls are also replicated in the second toolbar on the left.
In your data, by default the Feature Edges will be colored by the phasefield scalar variable. If you want a solid color, change phasefield to Solid Color. The default solid color is white. To change it from white, click the Edit color button.
Thanks, Ken, for your reply. I chose Solid Color instead of phaseField and the edge colors turned white. However, I cannot still change the color to some other color using the botton
Until that is fixed, there are a couple of ways to work around the problem. The first is to click on the palette pull-down menu ( in the first toolbar) and select Edit Current Palette.... In the resulting settings dialog, change the Foreground color to the color you want your feature edges and then hit OK.
The other way around the problem is to run a couple of filters to extract the edges and then use the surface representation to control the colors. To do that, first add the Extract Surface filter. Then add the Feature Edges filter to that. (That is, the Feature Edgesfilter, not the representation.) Then turn off the visibility of the Extract Surface filter in the Pipeline Browser. Now finally you can change the color as I described previously.
Thanks for reporting the bug. I am newbie to Paraview and I can follow your instructions step-by-step. Thank you sincerely for such detailed responses
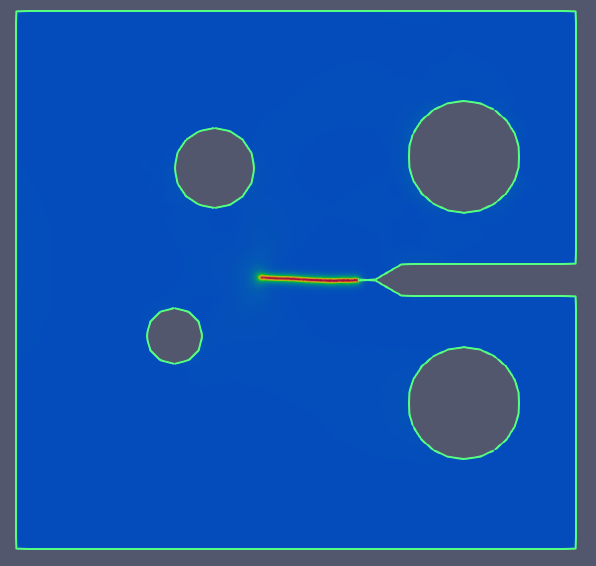
Regarding the Edit Current Palette approach: I can now choose the desired edge color, green. In order to arrive at my desired visualization, I then applied the Extract Component filter. Now in my pipeline, I have two entities, the original input data and the filter results. For the original input data, I have chosen Solid Color with Feature Edges representation. For the filter results, I have chosen phasefield with Surface representation. This is how the visualization looks at the end. I wonder if this is generally the way to do it. Is there a simpler way to get this visualization?
Regarding the other workaround involving Extract Surface and Feature Edges filters: This workaround works, too and I can arrive at the desired visualization.
The Extract Component filter is not really doing anything. That filter takes a vector field and pulls out one of the components to make a scalar field. If you start with a scalar field (as phasefield is), you get the same thing in the output.
If your intention is just to get the same data listed in the pipeline browser twice so that you can apply to representations at once, then this is fine. I would probably use the Pass Arrays filter instead, but in the end they will do the same thing.
One more piece of unsolicited advice: it appears you have applied rainbow colors to your data. Although they look pretty, I generally recommend not using them because, from a data-understanding perspective, they do not work well. There is lots of literature on this subject, but here are some quick blog post reads that describe some of the issues with rainbow colors:
I could be wrong, but I believe that the pass arrays filter is extremely lite weight. It is basically a shallow copy (i.e., just a pointer to the data).
Yup, Alan. That is the point. To create a shallow copy so that their are two items in the pipeline browser. (That’s the easiest way I know to draw something with two different representations at the same time.)
Another work around that worked for me (to color the Feature Edges representation) was to tick ‘Render Lines As Tubes’ under Styling in the Properties bar.
Hi Kenneth,
I tried your suggestion to change the edge color of my geometry (cube) from the default white to black; however, I am getting the broken black line on top of the white line. Would you please suggest something to get the black continuous edge?
That sounds like Z-buffer fighting, which happens when 2 things are being drawn in the same space. Sometimes the renderer thinks the black thing is on top, sometimes the white thing.
There is a lot that could be going wrong, but the easiest solution could be to turn off the rendering of the white edge on your cube.
Thanks for your help. Something else worked, though.
I did not use Feature edge filter or any other. I just changed the color in the existing pipeline Python calculator, considering solid, and edited it to black. It worked.