I would like to visualize the stream lines of my Electric Field.
I’m using a code that gives me the electric field components as output (2D --> Ex,Ey).
It’s varying over the time because I’m using different files for animation.
Is there a way to do that?
Ok, thanks.
Here for example there are 4 files.
field.pvd contains the electric field at a certain point with the two components.
field_ani_anim.pvd “calls” all the other files “field_ani_mesh_xxx” (I just posted here two examples) to have the animation over time of the variables.
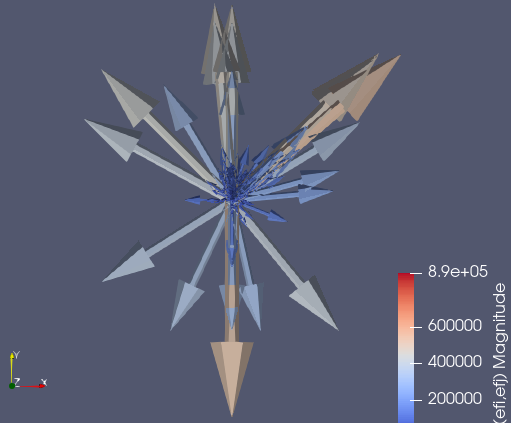
By now I can visualize the total magnitude and the two components of the electric field, but I would need to visualize also the lines considering it as a vector.
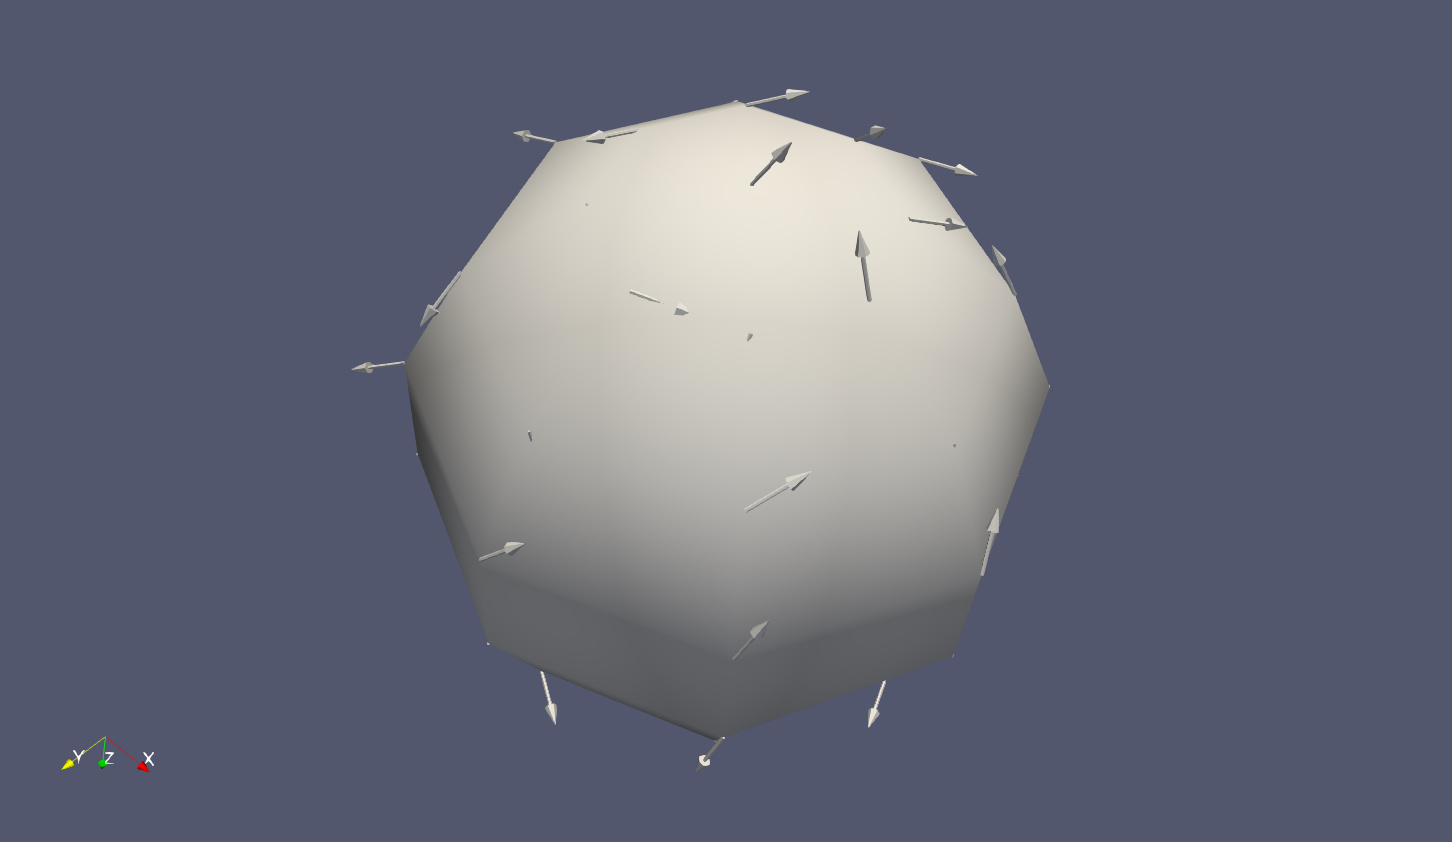
Yes I tried to do that. But this is what I got. I don’t know if the problem is in the properties of the filter I’m using or if I have to manipulate the files before.
Yes I’m trying to do that but the problem is as soon as I apply the filter my domain and my geometry disappears. Anyway I will work on it again and I’ll let you know if have more specific questions.
Thank you!