Electric/magnetic field lines seem to be a problem in Paraview by default. Especially magnetic lines, because magnetic field does not have a flow source.
You can not follow this tutorial, because THE FIELD is not made of particles. And vectors do not follow the energy transfer path, like particles do (more often, vectors are orthogonal to the energy transfer, but it is not a strict rule… I mean you need a complete set to understand the energy flow, equivalent of “speed field”, if you are not familiar with Poynting vector. But usually we are interested just in one component’s static picture, and other components are not available)
Displaying bent lines with density proportional to the field magnitude is not implemented in the filter set.
So, maybe there is a way to stack filters for adequate representation, like it was made foe particle flow by the link above?
input: nonuniformly spaced 3D grid of field vectors. the grid spacing is NOT related to the density of field lines. goal: bent field lines or a set of sequential (end-to-tail) bent arrows folowing interpolated vector field, with density of placement proportional to the (vector) field magnitude.
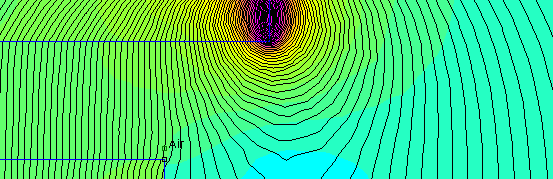
Like here:
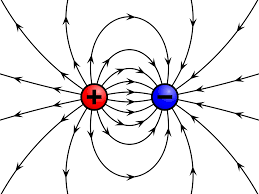
Or here:
which are pretty standard representations in electromagnetics
ParaView does not provide a way to create this kind of visualization, but I agree that it would be a great feature to add for electromagnetics applications.
I guess I already know the answer, but is this still the case? I’ve been happily using Paraview for about 15 years now, mainly for mechanical engineering, but this is the first time that it cannot plot what I need
This strongly resembles a contour plot of some field - not the same one as the field shown by color. Is there a way to compute a derived scalar field that you could contour with multiple isovalues to get an image like the one above? If so, you could use the Calculator or Python Calculator filter to compute it.
Otherwise, if the above image requires integration through the magnetic field and ParaView’s Streamline filter is not appropriate, I’d like to understand that computation better with an intent to someday provide a filter to compute the bend field lines. Could you point me to any resources that describe the computation?
I’ve made magnetic field lines by following magnetic field vectors with the Streamline filter. It generally works although it can have numerical issues.
I’m not sure why that approach would not have worked for the data in this post. There is not a lot of detail given here why it would or wouldn’t.
IANAPh (I’m not a physicist ;-)), but key is that the density of the field lines is proportional to the field strength. This cannot be achieved when using the stream line tracer, right? Correct me if I’m wrong. I will do some digging on how to draw such lines
Update, 30 min. later: FEMM only does 2D calculations and drawings, but this is where the contours are created:
The problem is not in density. The problem is in the propagating EM fields being a transverse oscillating, or rotating tensors. Every vector is orthogonal to the Energy flow “Poynting” vector. They do not follow liquid stream logic. The difficulty with equipotential representation is that it is implemented as surfaces complicating visual representation and not well explaining the field curl; particularly when dealing with antenna excitation fields and boundary confined waves. You can’t draw field lines like you see it in textbooks, in Paraview. Therefore standard Paraview algorithms simply 1) do not connect vectors into streamlines. 2)Do not track evolution of such “streamlines” even if some were accidentally connected, creating a useless chaotic animation. In general, the only way left is drawing unconnected vectors originating from fixed mesh nodes.