Error while plotting Streamline in 3D Plot

Dear All,
I want to plot streamline from 3d CSV Data that includes columns as [x, y, z, u1, u2, u3, T ].
where,

x, y, z - —> 3d co-ordinates
u1, u2, u3 --------> velocity components along x, y, and z dirn resp.
T → temperature value at (x, y, z) coordinate

I want to generate streamline using this CSV data. For this, I have followed steps as:

  1. upload data
  2. Applied filter convert data in TabletoPoint
  3. Applied filter Delanau 3d
  4. Applied filter Calculator for computing Steamline equation and the equation is
    streamline = [ Vx * iHat+ Vy * jHat+ Vz * kHat ]

but, it is showing an error as “Undefined symbol Vx”.

Kindly help me to fix it.

CSV data is
data.csv (332.6 KB)

Hi,

There is no Vx data array in your file. Do you mean u1 ?

Yes @nicolas.vuaille

Here, Vx -----> u1, Vy----> u2, Vz------>u3

Also, please suggest the steps for generating the streamlines and Velocity vector.

Thanks for acknowledging the topic.

Hi,

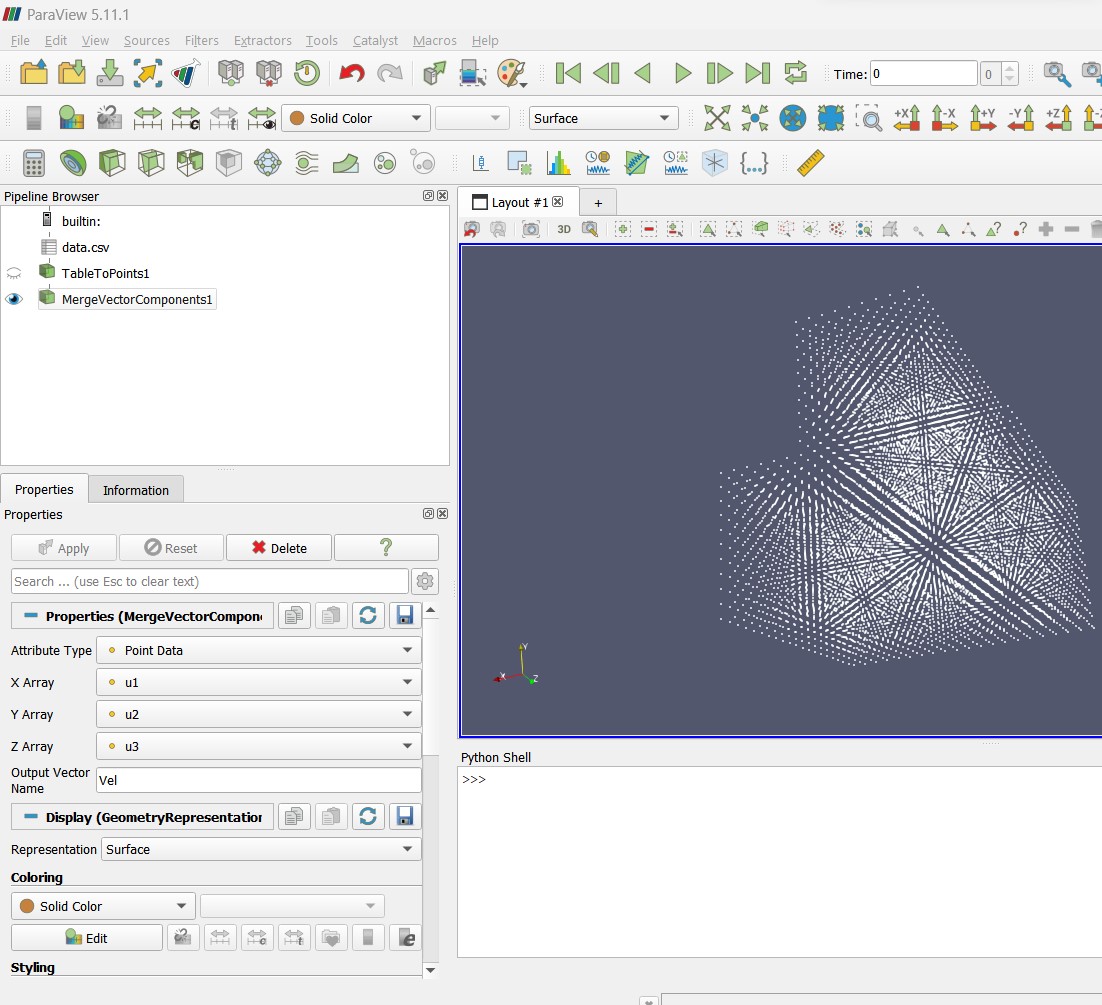
you can merge velocity components into one array using Merge Vector Components.
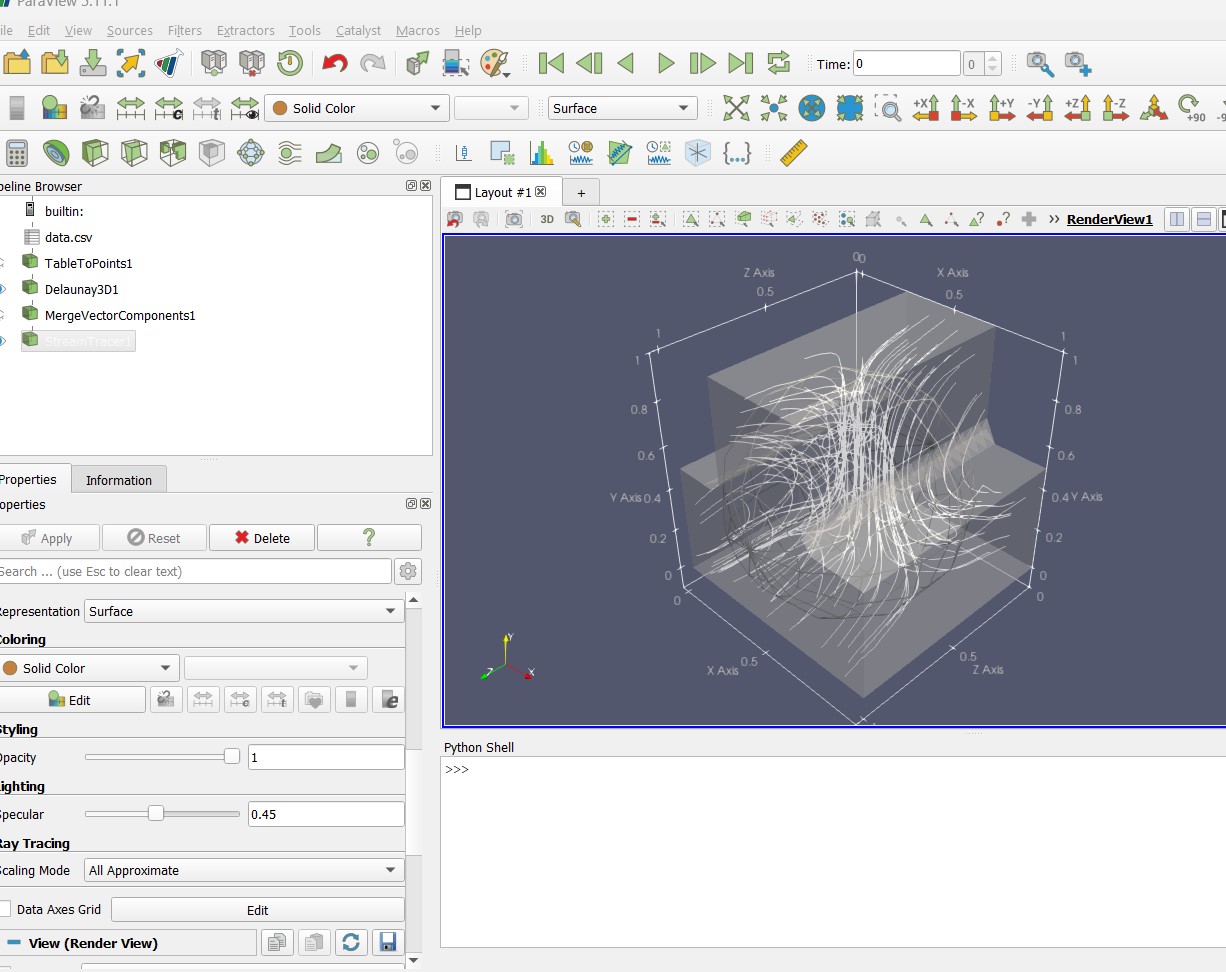
you can try the Streamlines filter, that creates streamlines (from some generated seeds)

1 Like

Hello @nicolas.vuaille
I have followed the steps

But as I am applying the streamtracer option on Velocity vector, the Paraview gets closed completely.

can you comment on it?

Also, I have attached the snapshot for your reference, please comment on the steps.

Ugh, indeed, there is an issue here …

edit
Streamtracer expects a connectivity between points, so it wont work on point cloud. A solution is to add a Delaunay 3D after the Table To Points.

edit2
an issue is already open about the crash: https://gitlab.kitware.com/paraview/paraview/-/issues/13249

1 Like

Now it works correctly for me.

May I ask one more doubt for
a) Domain includes a hollow cylinder having a center (0.5, 0.5, Z) and Z varies from 0 to 1.

Can we plot results for such a domain using CSV data?

Nice!

I’m not sure to understand what you want to do:

  • plot: which kind of view do you expect? in paraview plot means line chart
  • results: which data ? The vector field ? The streamlines ?

Also, feel free to create a new post if needed

1 Like

Thanks @nicolas.vuaille Sir for your quick response.
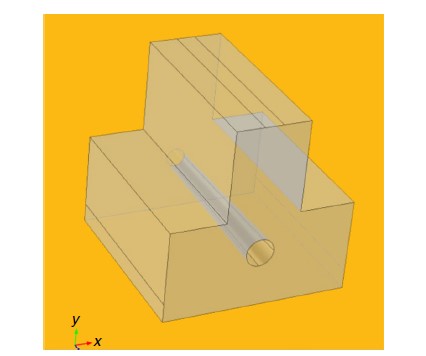
Firstly, I am trying to generate the 3d domain (attached fig) with CSV data, where a circular cylinder is placed at the center.

Mainly to avoid the 3d triangulation to the inner cylinder and then other result plots (streamlines mainly).

tcircle

Creating meshes (including surfaces) from point cloud is not so easy task.

I fear you need Delaunay. Then you may Extract surface if you do not want inner triangles, and you can Clip with a cylinder to remove the inner cylinder.

Also, if you have more issues with this part, a new post may be more appropriate: I’m not expert on meshing and people who does will not be catched by this post :slight_smile:

1 Like