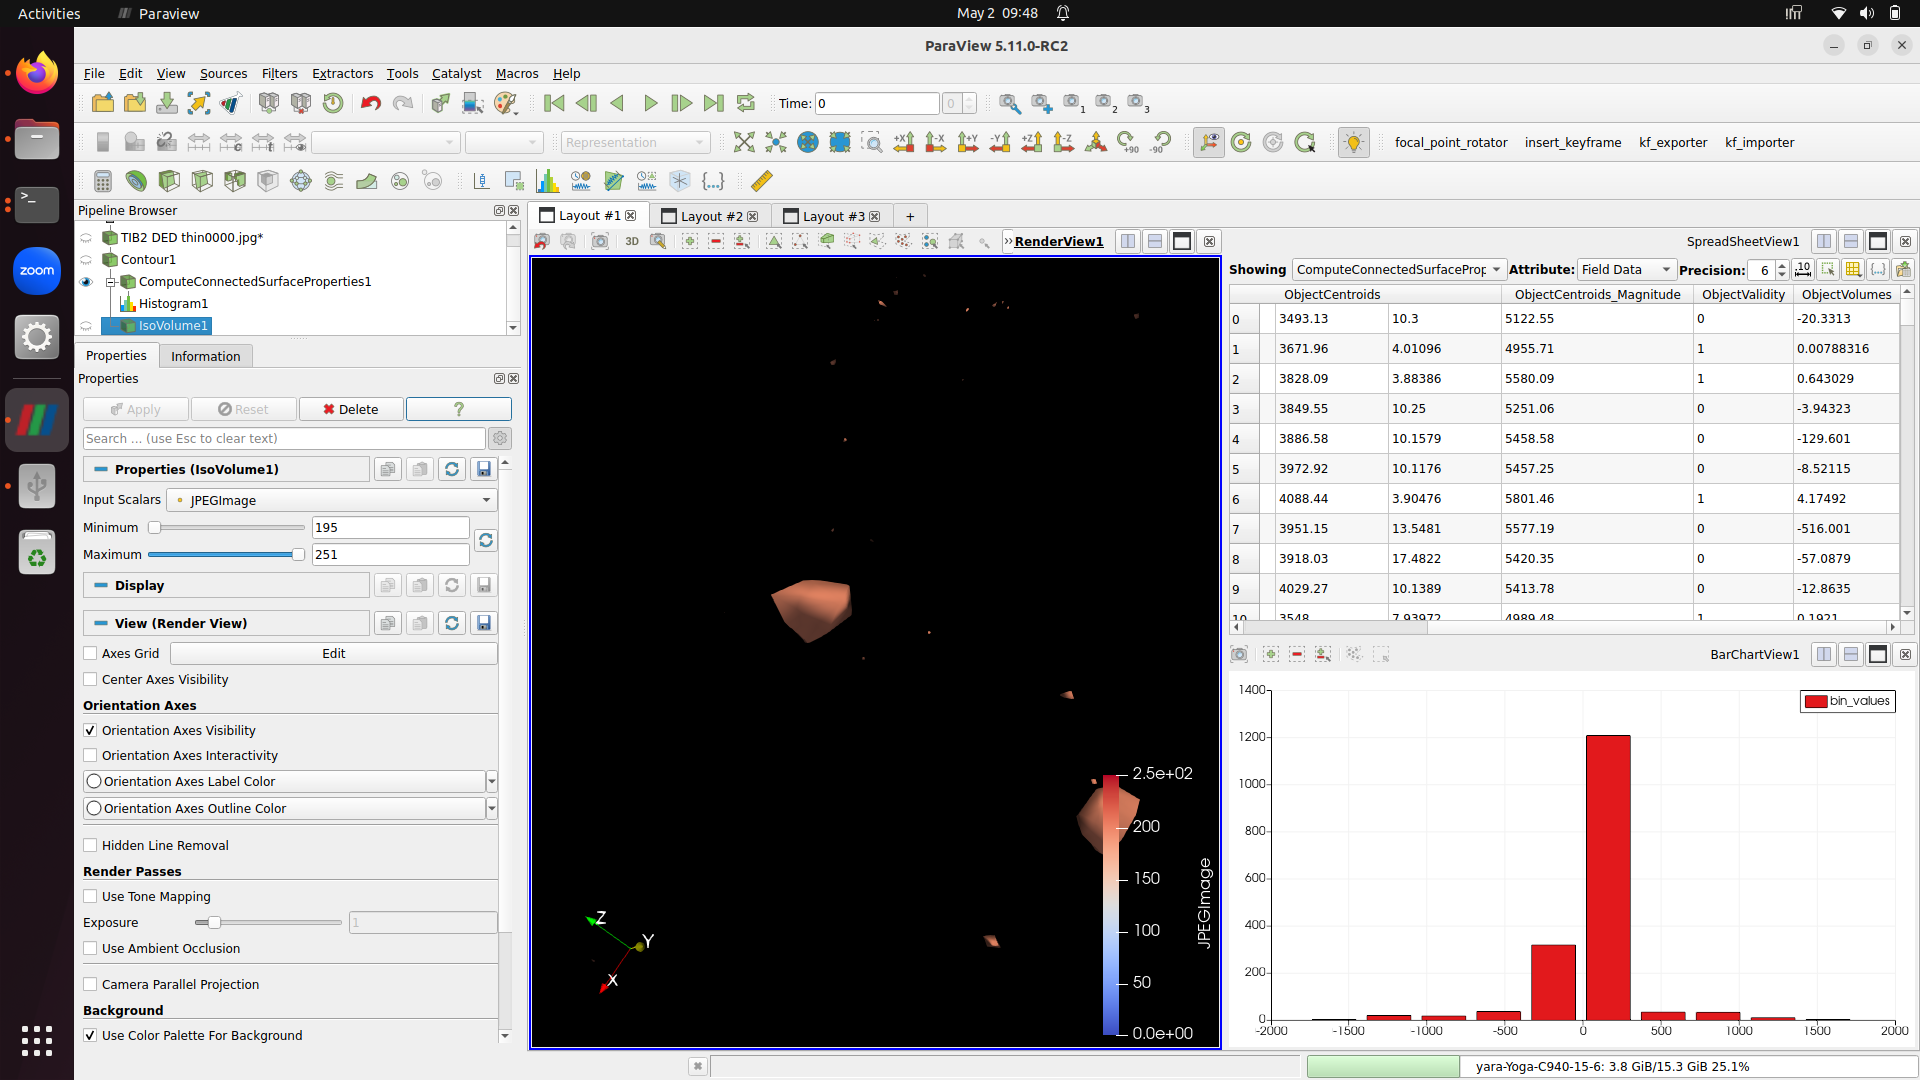
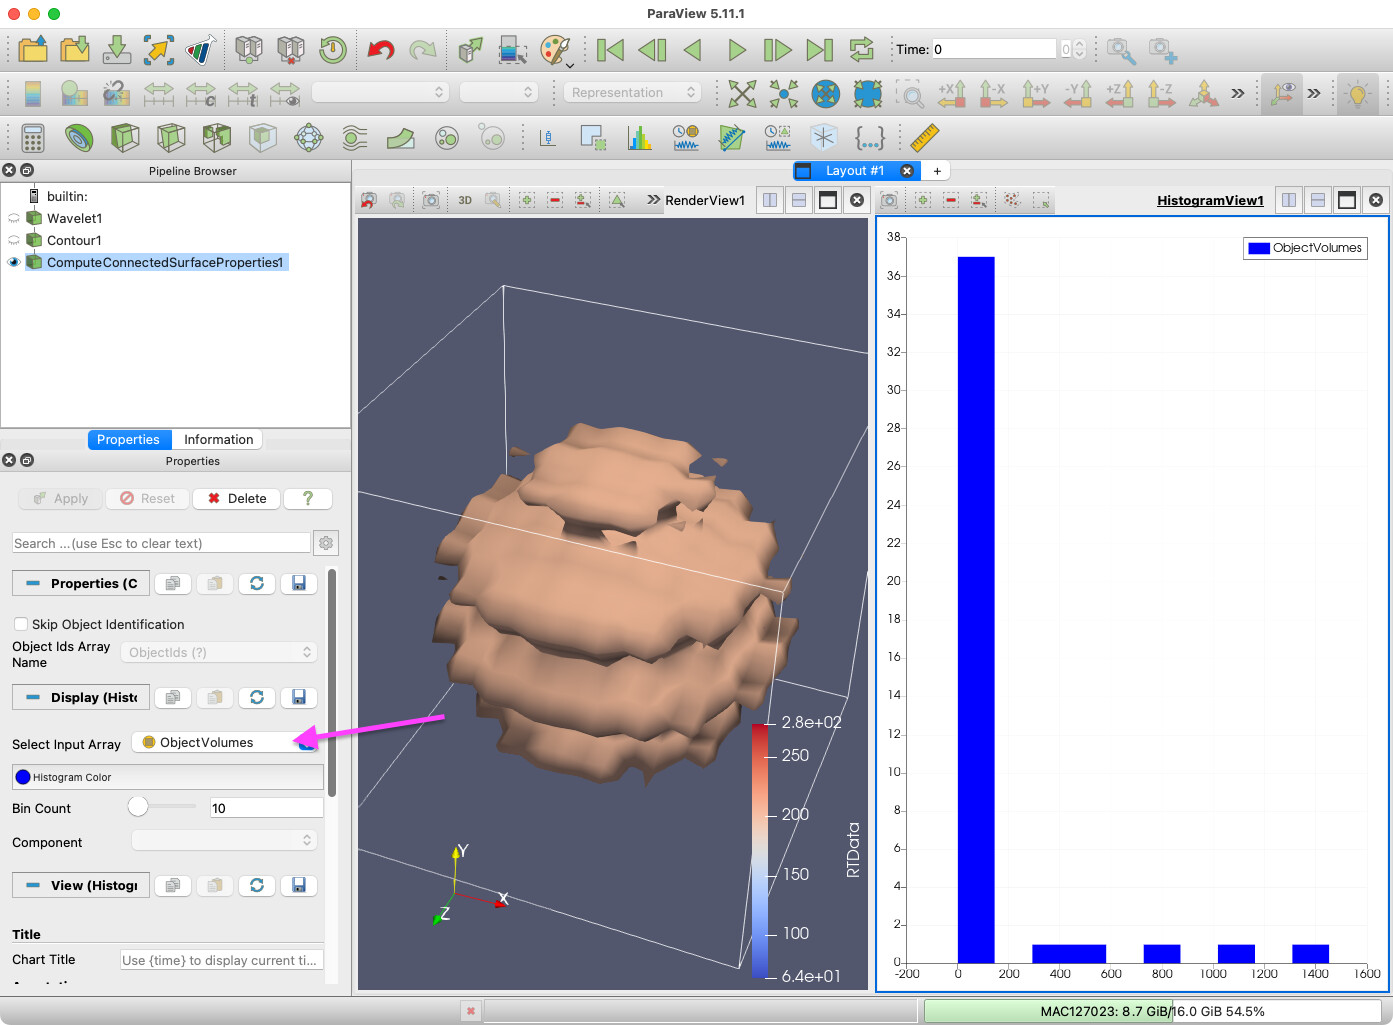
I’m helping out a researcher and they are interested in isosurfaces of a CT scan and calculating the volume enclosed on the interior of these spheroid shapes.
You can see some of these in the image. We are using compute connected surface properties, and it appears that the object volume field that we are showing in the spreadsheet view is close to what we want (but sometimes negative?) but we also can’t plot that value in a histogram.
There are a couple of questions in here. The first is the ability to take a histogram of the ObjectVolume field created by Compute Connected Surface Properties. It looks like the Histogram filter is not capable of computing on these “global” fields (which I think is a feature gap). But you can get around the problem by using the Histogramview, which does support them.
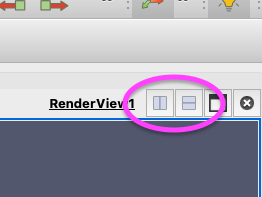
To make a Histogram view, first create a space in the view area by splitting a view horizontally or vertically.
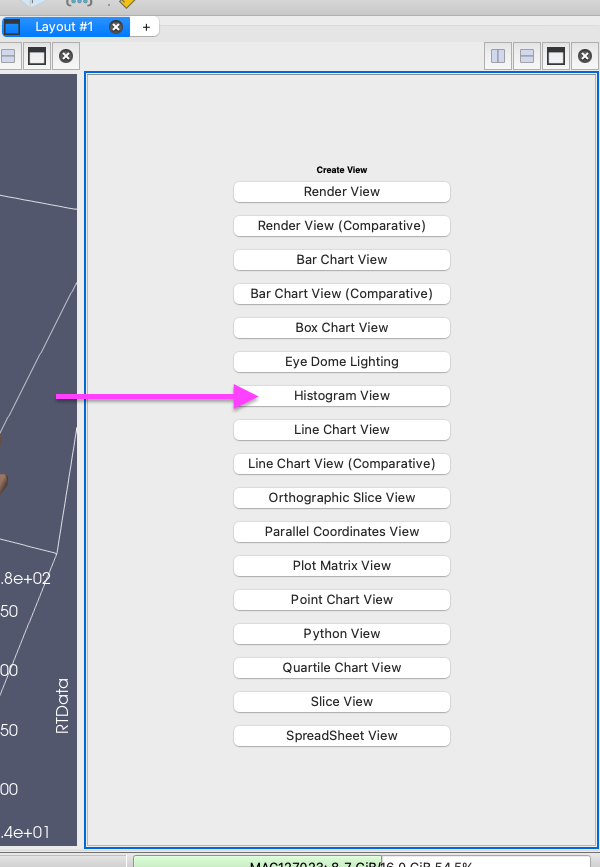
In the new view, you will see a bunch of buttons to define the view. Click the button that says Histogram View.
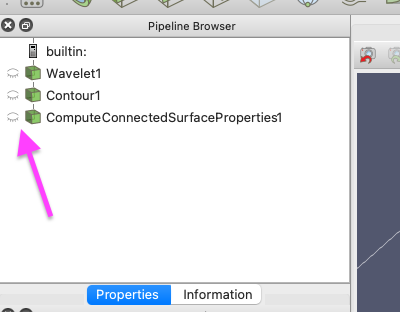
The second question was about negative volume values produced by Compute Connected Surface Properties I don’t know enough about this filter to know the answer. (I didn’t even know it existed until your post.) My guess is that the filter is making some assumptions about the structure of the surface and the result comes out wrong when the inside/outside of the filter is not clear. It might be because the surface is not closed (because the isosurface is at the edge of the domain), the surface is not simple (because two surfaces are touching), or there is a large concavity fowling things up. If you find a negative value, you can take note of the row in the spreadsheet and use the Threshold filter to extract cells with ObjectIds equal to this row number. @spyridon97 might be able to give more information. I think he is the one that added this filter.
Compute Connected Surface Properties uses the vtkMultiObjectMassProperties class. If the volume is negative, there are 2 possible cases. Either a validity check has not been performed (which ensures that the orientation of the points of the cell is correct) or there is a numerical error during the computation of the volume due to very small numbers being multiplied/added.
If you could provide me with some reproducible steps that create negative volumes, i would be able to check out which of the cases is it.
@Kenneth_Moreland Thanks so much for helping us see how to make histograms that show those field values!
I’ll also do some snooping about the surfaces that seem to be failing the check. I was searching and it sounds like the algorithm that is calculating volume relies on the direction of a normal vector which in some cases might be pointing the wrong way? Negative cell volume
@spyridon97 thanks for also jumping in. Let me get you a collection of the data.
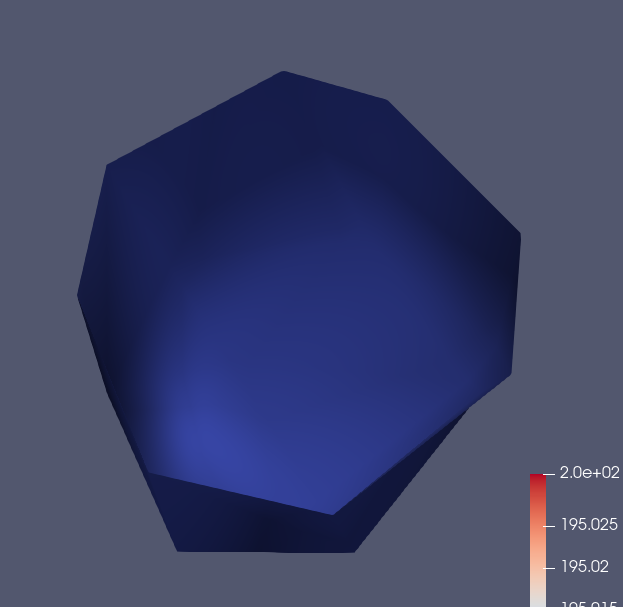
Sure enough, now that I check the column next to the volume the validity score is 0 not 1. and the row that I checked on using @Kenneth_Moreland 's steps shows a nice big unenclosed mesh.
I suppose this is very close to what they are after, but it would be nice if the threshold filter was able to filter on “objectVolume” so that I could stipulate that I only want the surfaces shown that were valid. Unfortunately I seems like the scalar and cell variables are the only options. Is there another way to help clean up this collection so that the histogram will represent the distribution of valid enclosed mesh objects with a particular iso surface value?
I’ll meet with my researcher to try to find out what steps we want to take next.