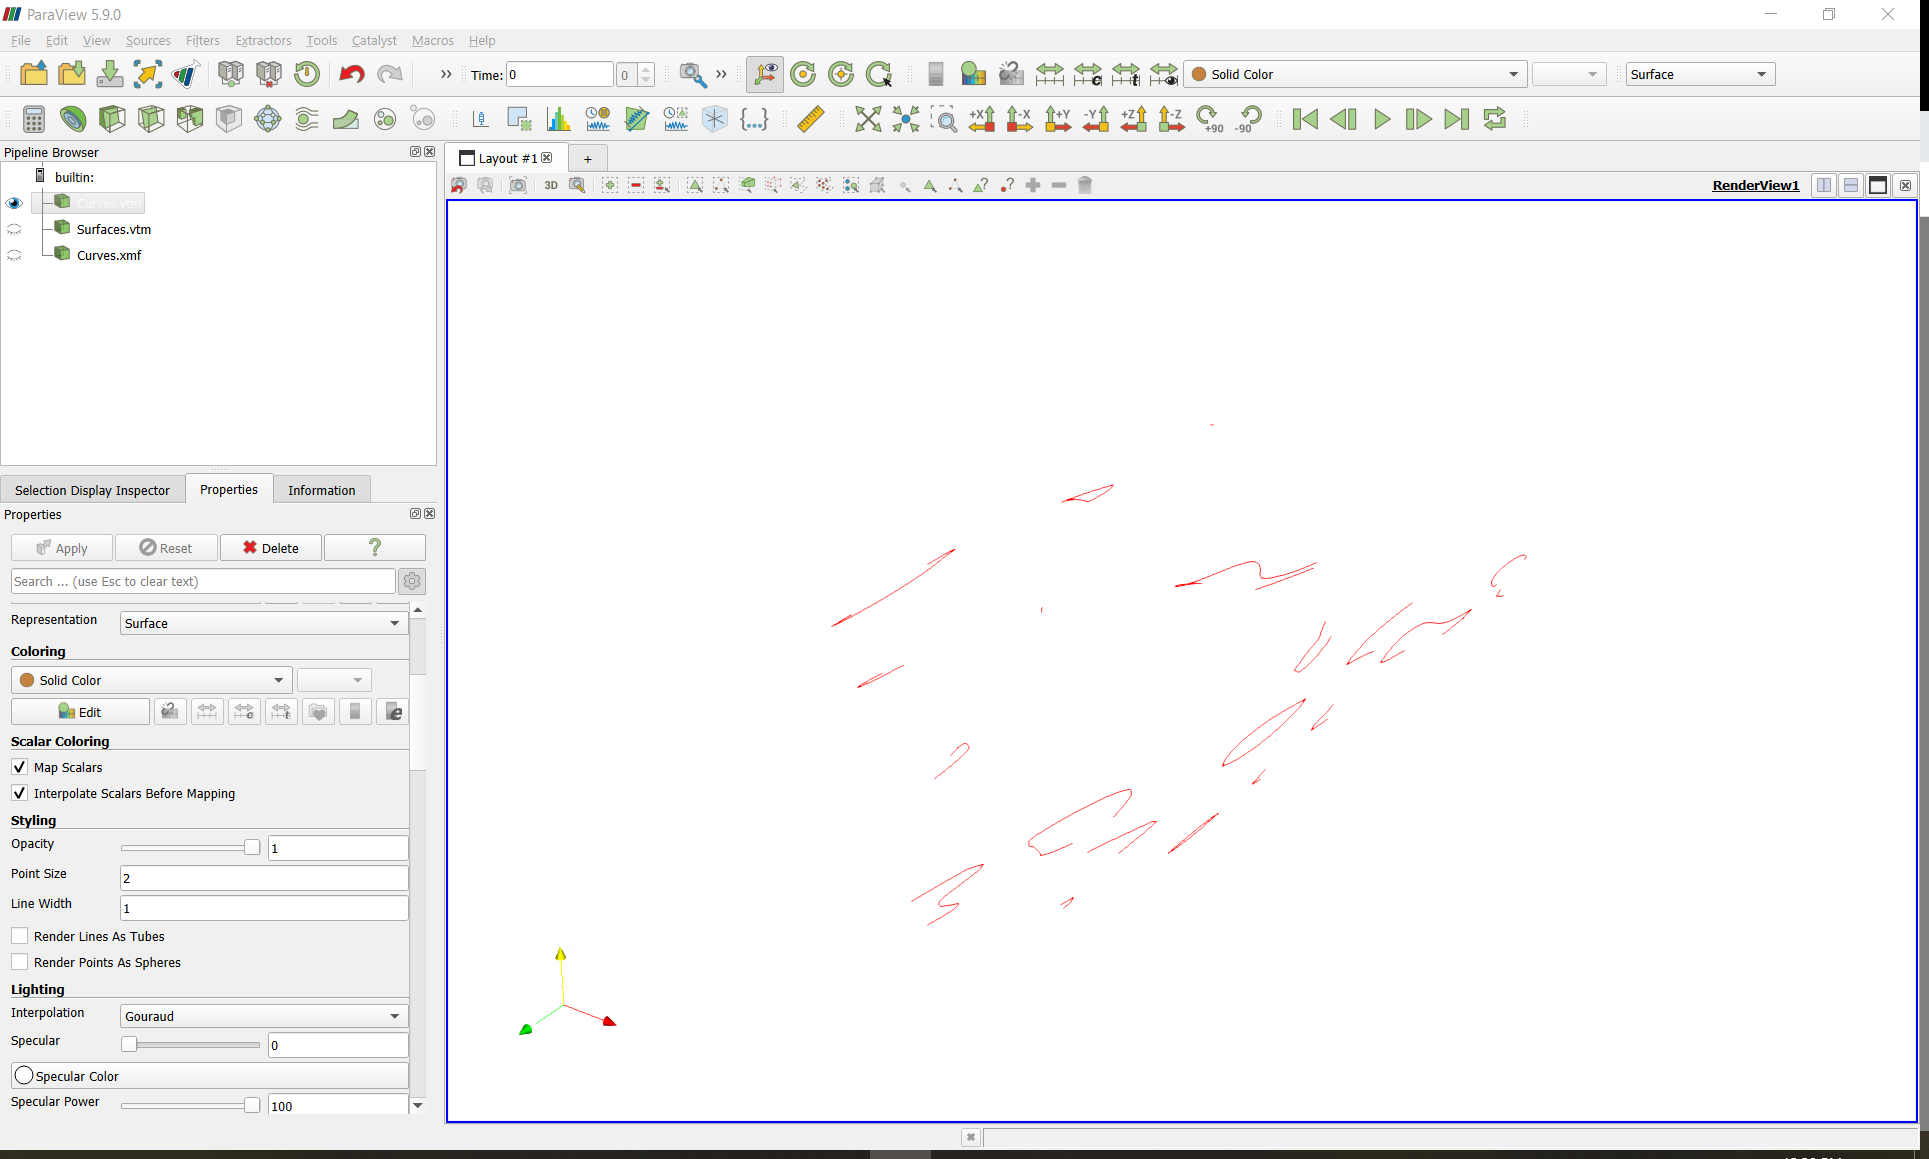
I have got some curves(cross-section of 2 groups of iso-surfaces) in Paraview and would like to detect the features (position,length, and so on) of these curves.
The curves I got look like this:
What I am trying to do is to first export these curves into a .CVS file, and then read it into python and detect the features with OpenCV.
The problem I have right now is when I export the curves into a .CVS file. The points keep their original order, which is the order in the original 3d space. This means that the points are not grouped based on which curve they belong to, and the order of points become messy.
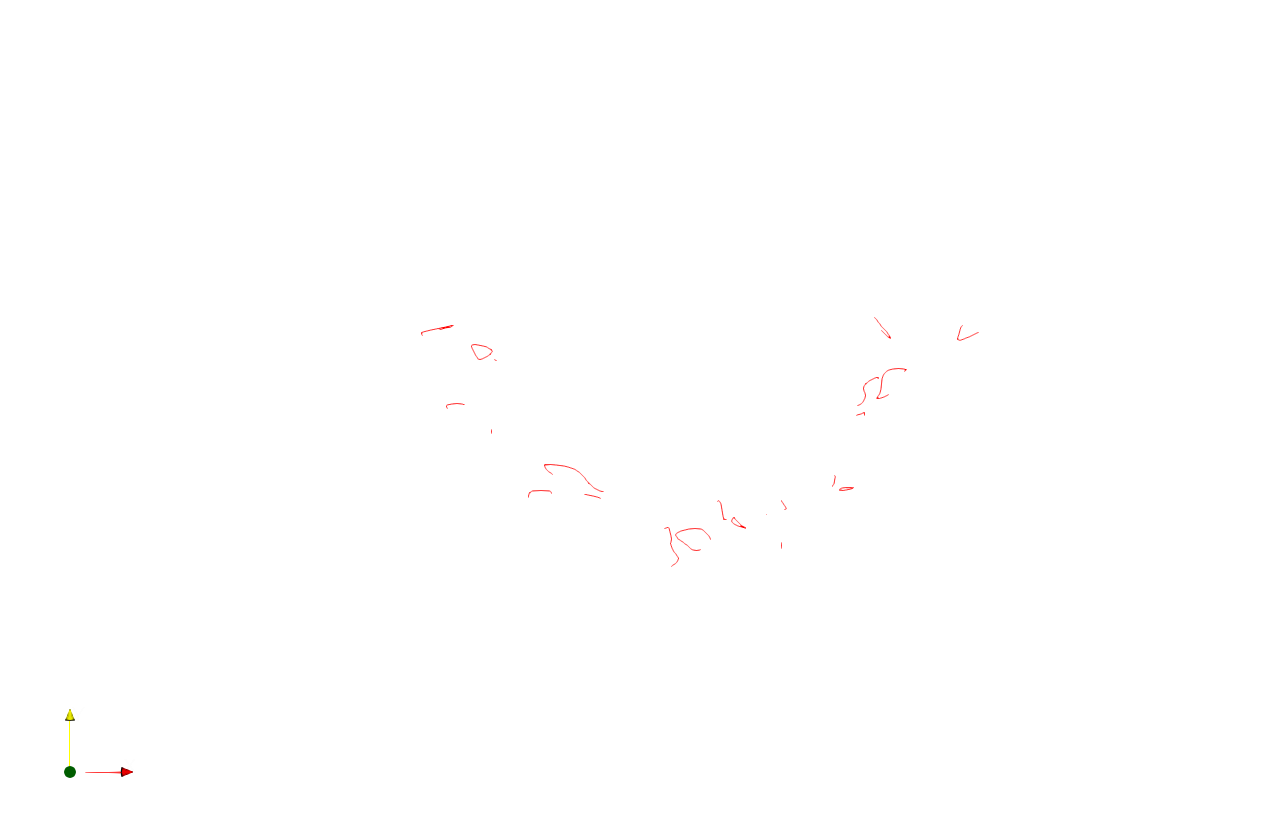
When I connect points in excel, it looks like this:
There is no way, as far as I know, to force the points in any particular order.
A simple place to start is to run the Connectivity filter. This will create a RegionId field that identifies the connected parts of a curve. You can use that identifier in an Excel pivot table to derive quantities like center of mass.
That’s correct, I have a multi-block dataset.
With your method, I am able to group each point based on which curve or surface it belongs to now.
And I think this is probably good enough for me, maybe I can go on without the order of points inside curves or surfaces.
Finally!! I am able to group the points. I have been work on this for a long time.
You definitely saved my day!
Thank you SOOO much!