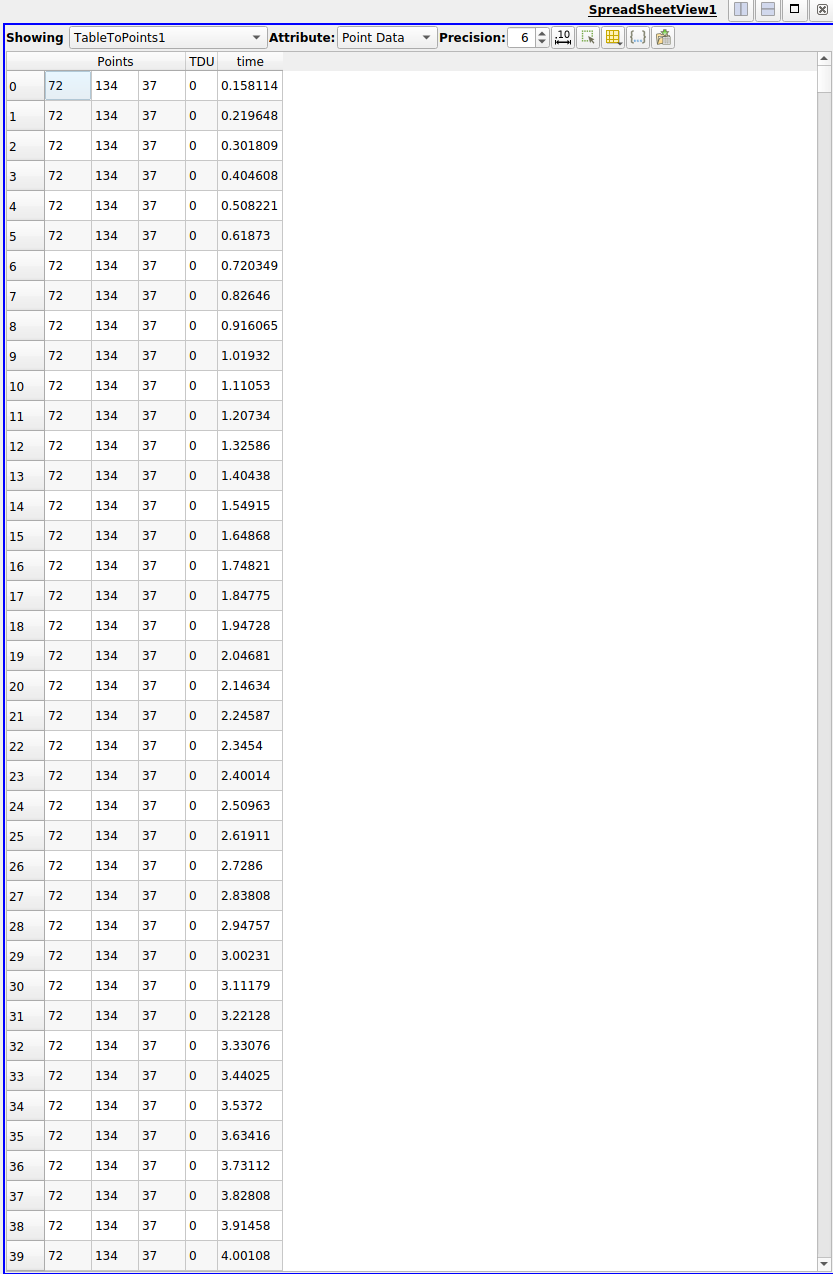
I’ve imported a .csv with x, y, z coordinate information for one single point, a value that I’m interested in colormapping, and a time stamp. I’d like to extract the time steps from the time variable and apply that to the Paraview animation feature. So ideally each row would represent a discrete time step.
Is there a way to do this without loading in a separate .csv for every time step? I’ve included a screenshot of my spreadsheet view that hopefully clarifies what I’m trying to do.
Thank you,
Anthony
This is not directly supported. However, if you download this example and load it as a plugin and then use the Python-based CSV reader to open the csv file instead of the standard CSV reader, it would treat the “time” column as time.
Thank you very much for your help! That’s exactly what I needed.
As a quick followup question, is there a way to map the remaining TDU column to a color map for a source, say a cylinder object? I’m having trouble figuring out how to link the imported .csv with the created cylinder source.
Thank you,
Anthony
TDU should be added as an array in the output dataset. You pick that array as the array to the color by from the color-selector dropdown in the tool bar or the Properties panel.
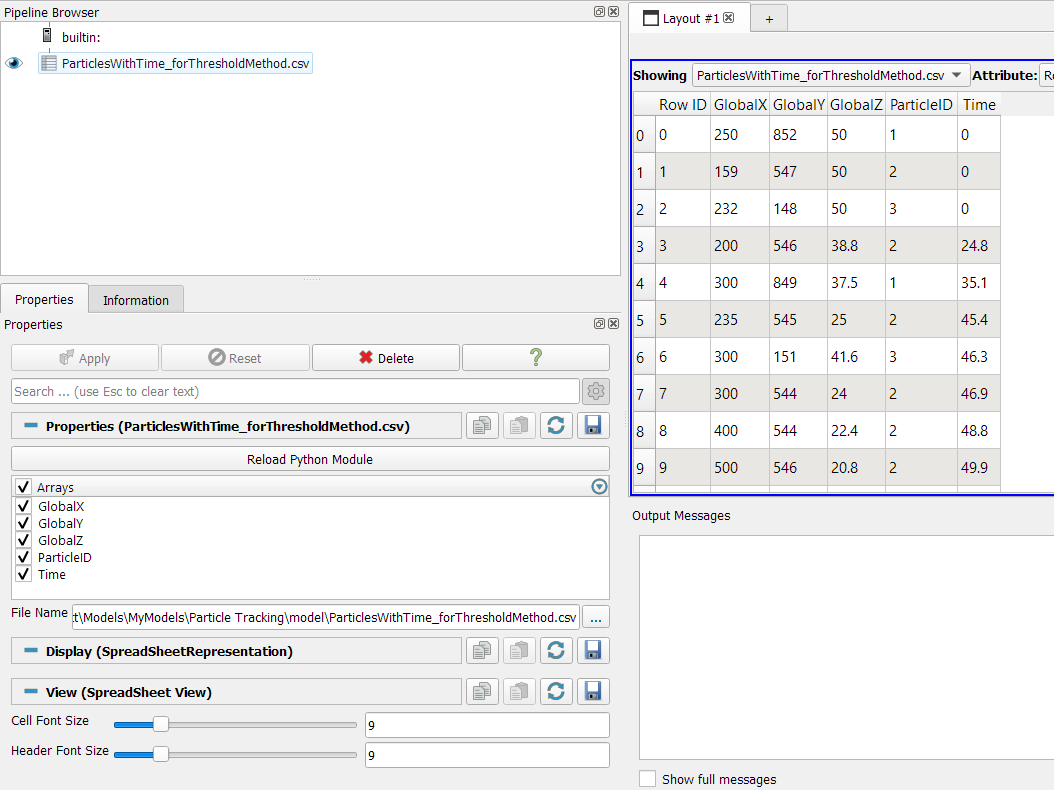
Hi, bumping an old thread here, but I have a question about the Python-based CSV reader linked above by @utkarsh.ayachit. Happy to move to a new thread if that is preferable.
I have installed the plug-in and have used it to import a csv file of particle locations with X Y Z and time columns, but I can’t figure out how to actually access the time column so that I can plot the particles moving as time progress.
@utkarsh.ayachit / @amarcozzi11 would you be able to give me any pointers on how to get this workflow…working?!
Thanks!