Hello everyone
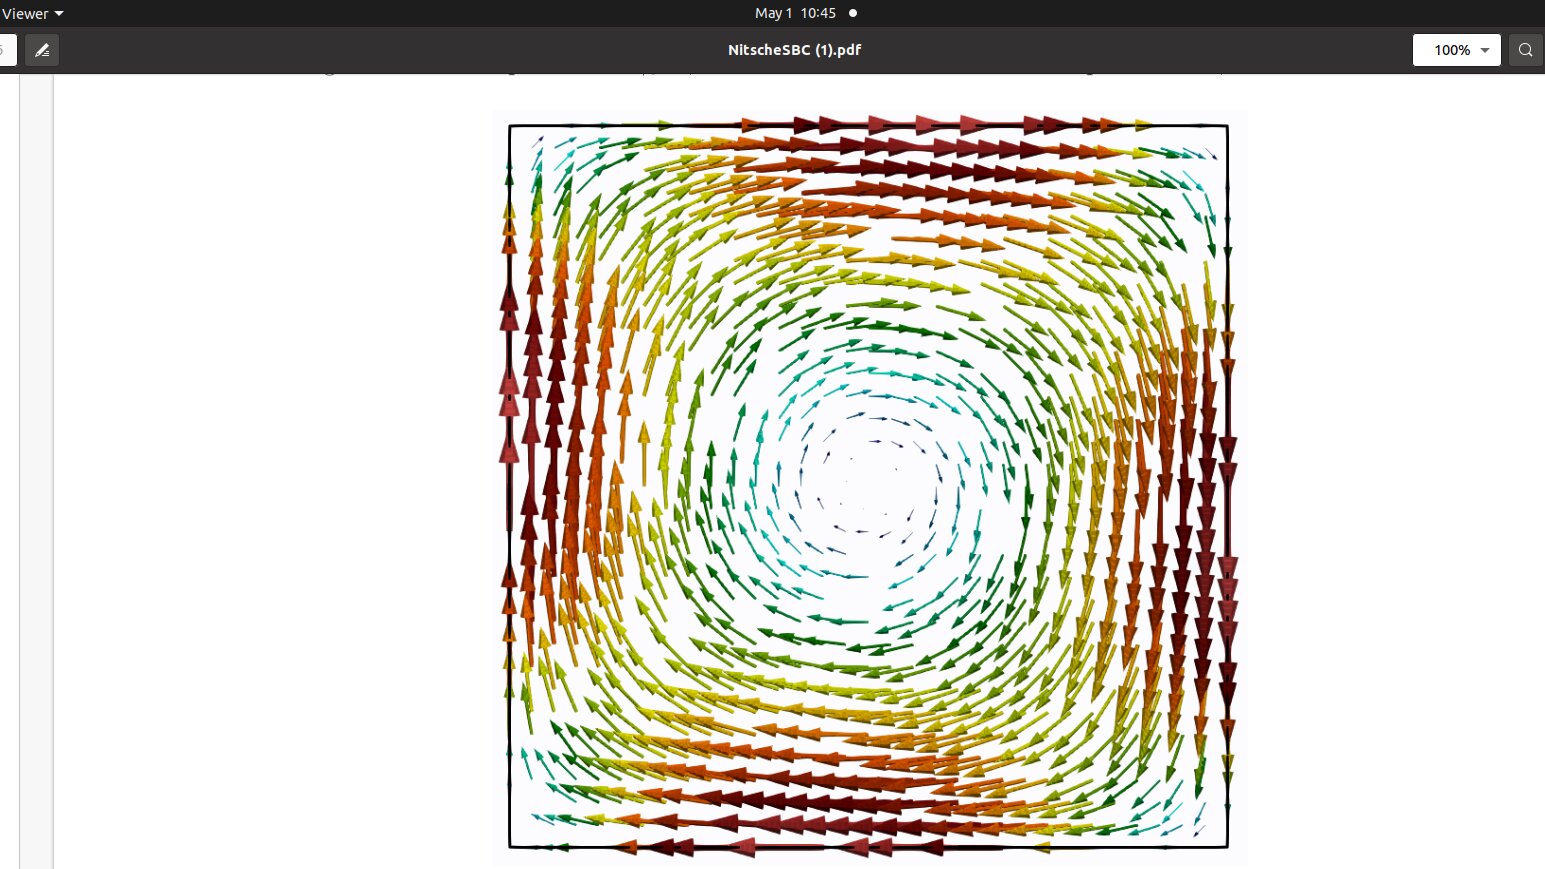
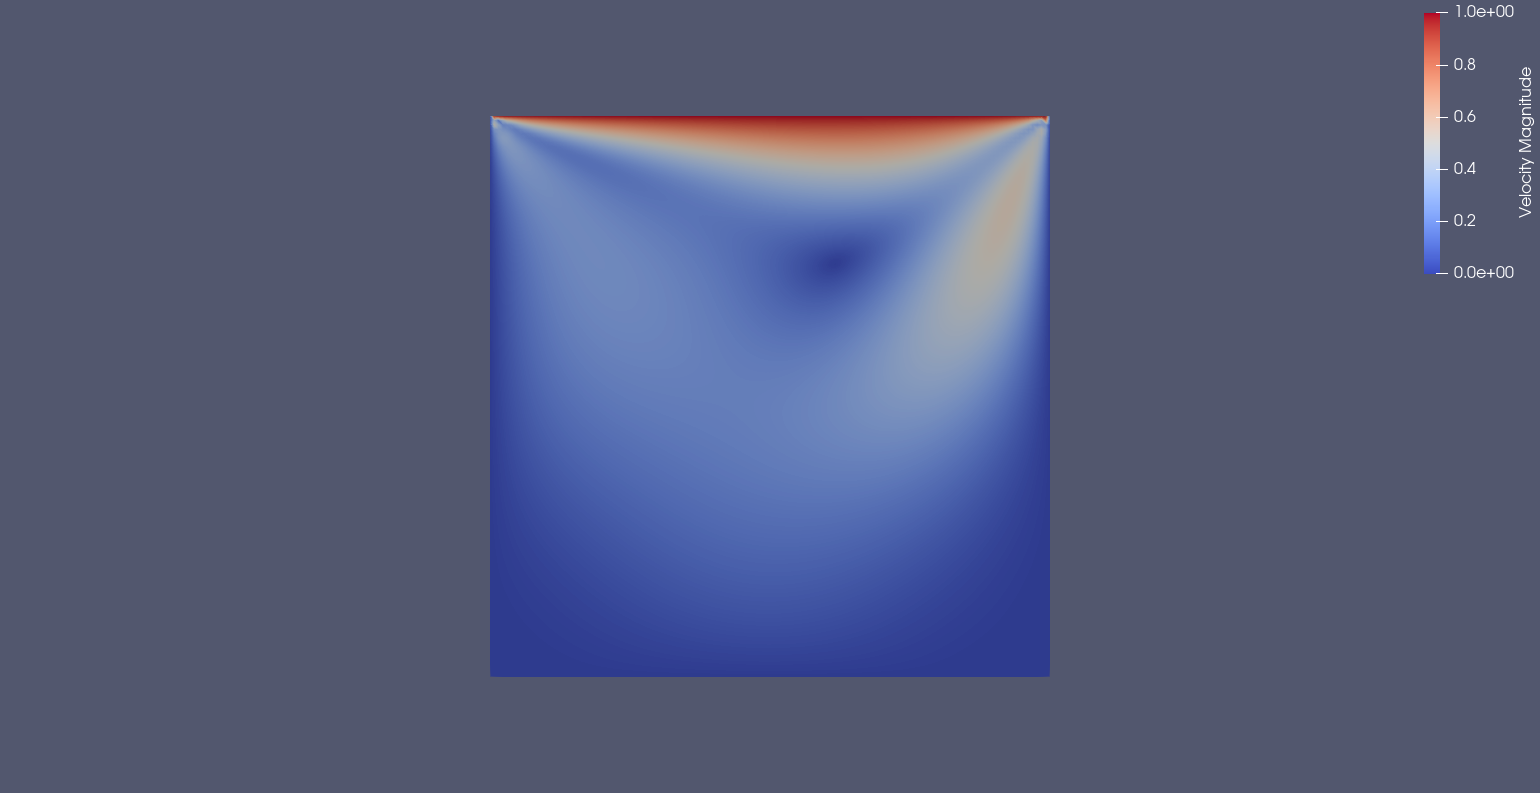
Below I attached the pvd file and plot of velocity for lid driven cavity problem. I want to plot a graph of type which I attached below in a screenshot but unable to do that. Please help me in this regard.
I am using Paraview version 5.9.1
cavity.pvd (174 Bytes) cavity_0.vtu (1012.9 KB)
please help?
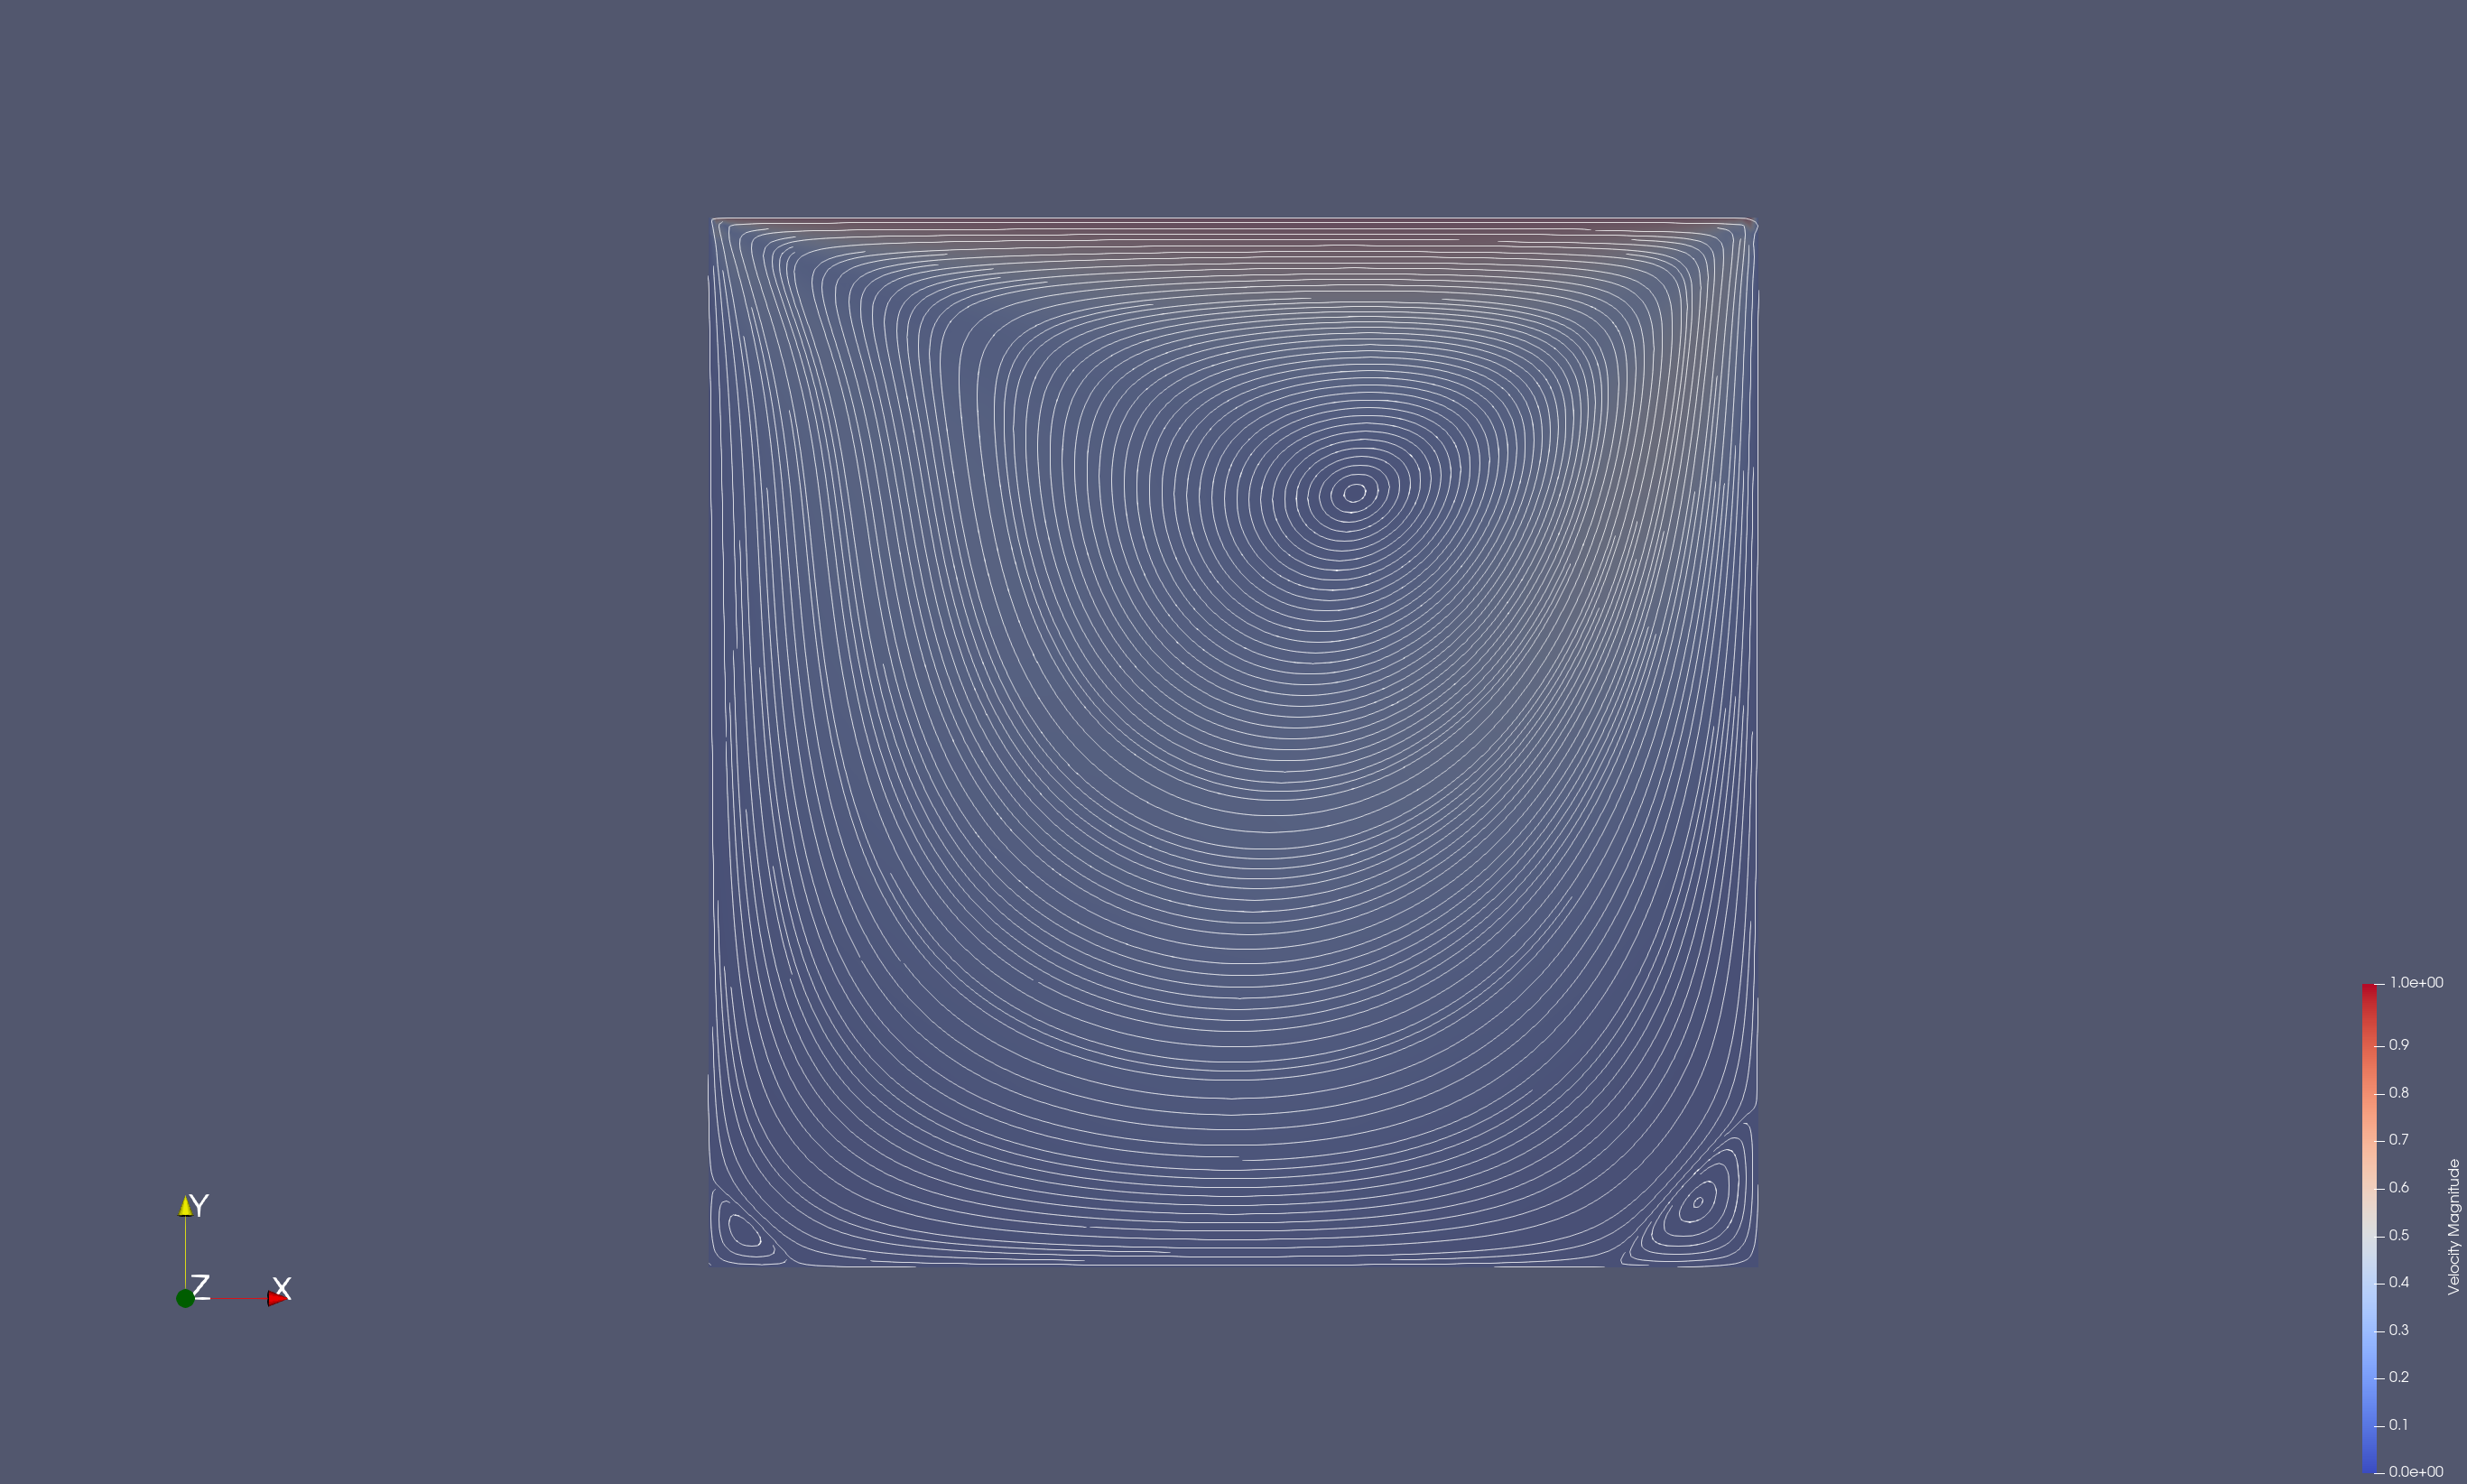
You could use either Stream Tracer or Evenly Spaced Streamlines 2D.
Here is a paraview state file using the second filter and the image produced.
streamlines.pvsm (332 KB)
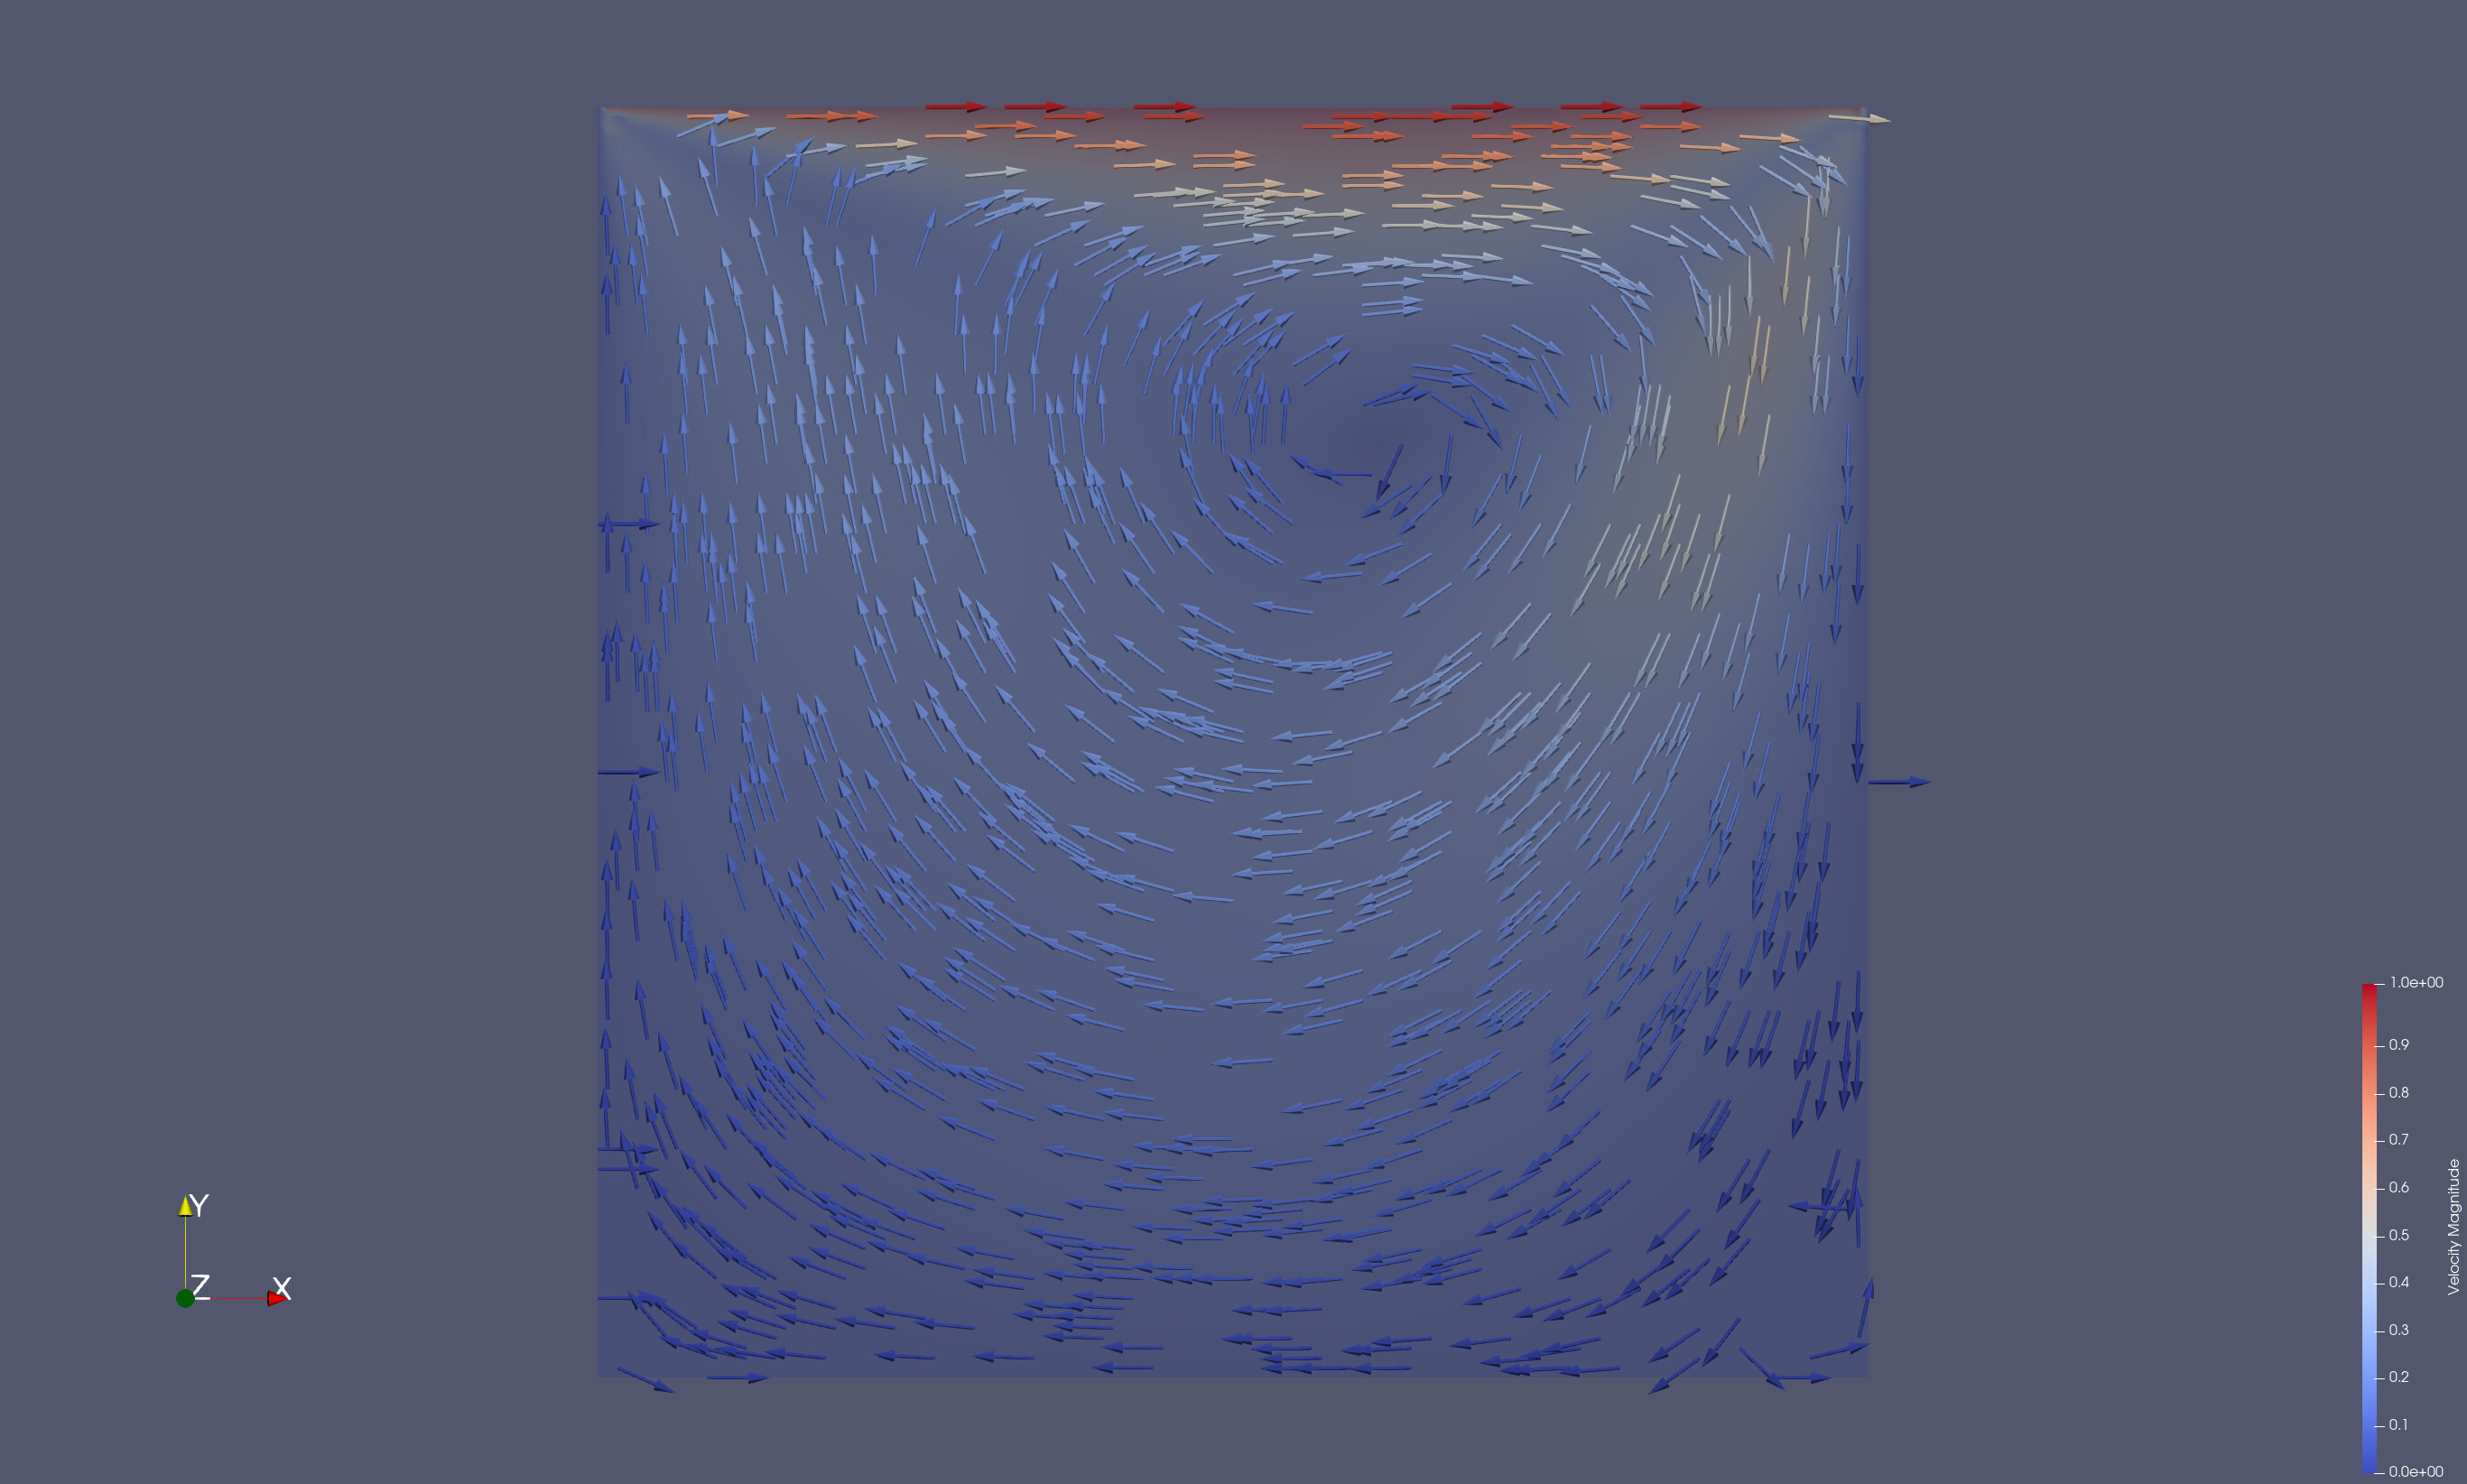
Here is a version with glyphs.
glyphs.pvsm (341 KB)