I am importing a data set of .vtu files and used the “Plot data over time” filter to plot my data. I now want to apply a FFT using the “FFT of selection over time” and I get an error that says “No time steps in input data”. I am plotting time vs. velocity. Has anyone successfully used the FFT Filter on a set of data. Can’t find any sources on the web. Thanks in advance!
I’m guessing that you need to run the FFT Of Selection Over Time filter before adding the Plot Data Over Time. The FFT Of Selection Over Time filter will automatically pull data over time. So does the Plot Data Over Time, and these filters confuse each other.
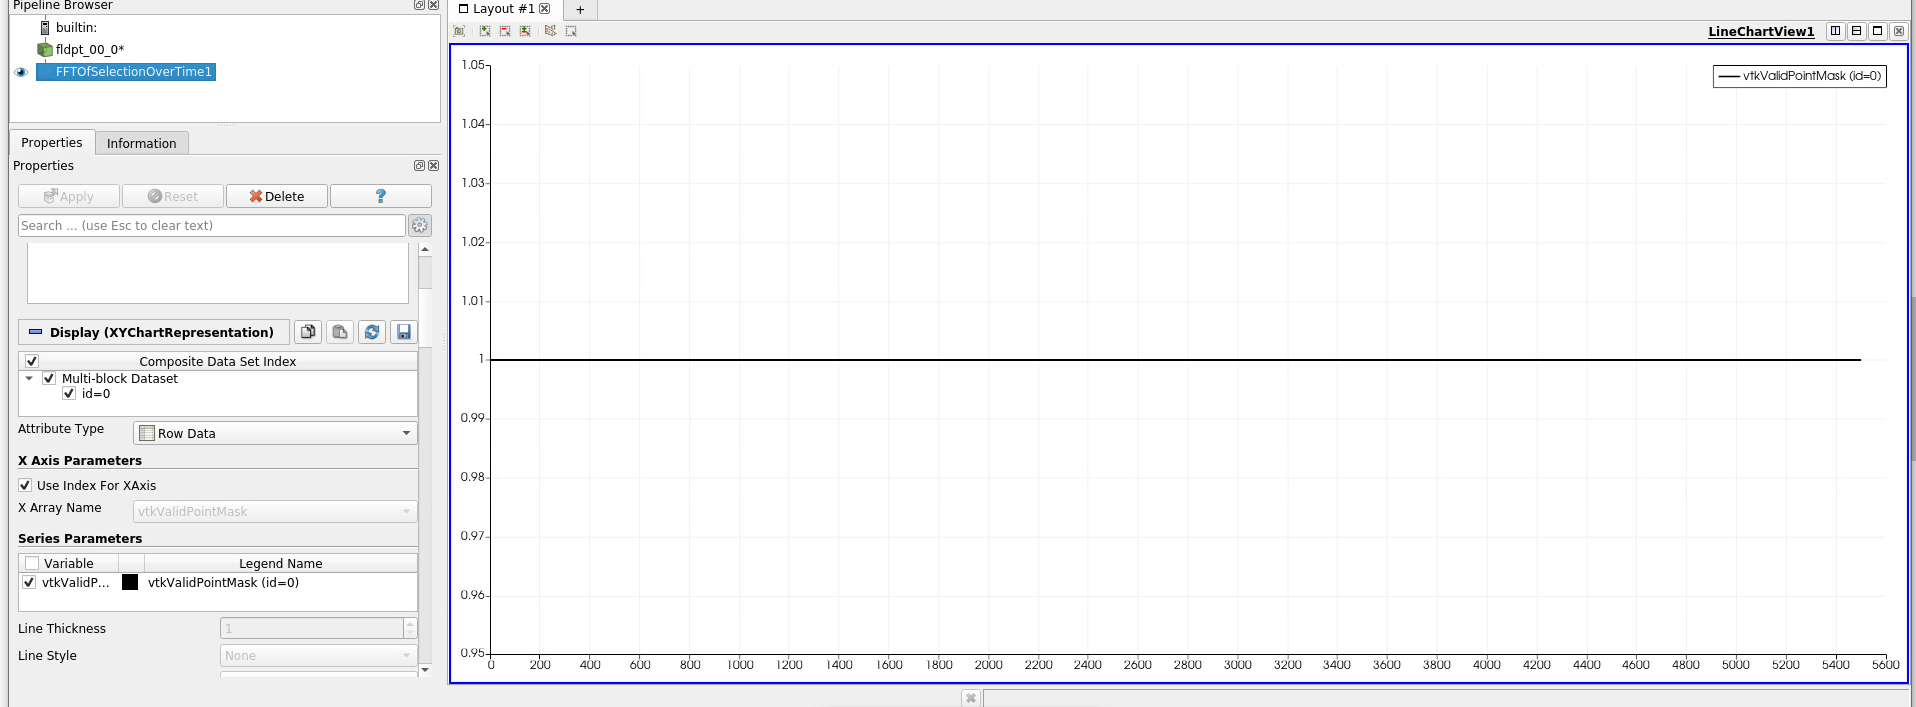
The process ID is no longer -1. Here’s screenshot after applying the FFT Filter. I checked the vtkValidPointMask (id=0) box to see the horizontal black line.
Is your selection of the same type as the field data you are taking an FFT of? If you are taking an FFT of point data, is it a point selection? If you are taking an FFT of cell data, is it a cell selection?
Also, I believe the FFT only works on scalar data. If you are trying to take the FFT of vectors, you will have to use the Calculator filter to first extract whatever components or magnitude you want an FFT of.
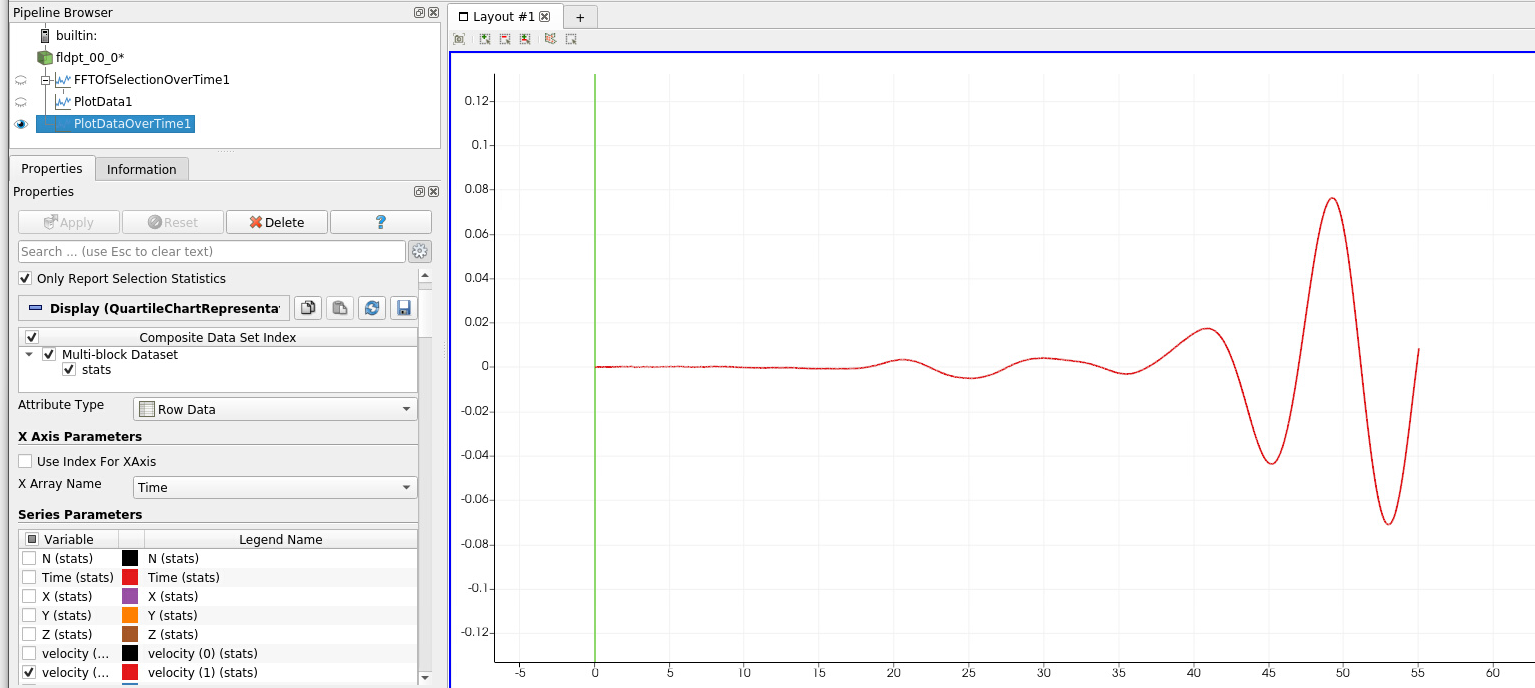
I applied the Calculator filter, set it to scalar velocity_y, then applied the FFT filter onto the Calculator Filter, and here are the results. I also trimmed my data from my previous replies from [0, 55] to [44, 55].
The X axis is not time. It is just the index into the array. The FFT Of Selection Over Time filter does not compute the frequencies, so the plot just gives you the indices of the array holding the values computed by the FFT. The frequencies wouldn’t mean much anyway since the the vtu file series does not properly mark time anyway.
Since both FFT Of Selection Over Time and Plot Data Over Time are using array indices for the x axis, and both arrays are the same length, they look the same. But they do not have the same meaning.