Dear all,
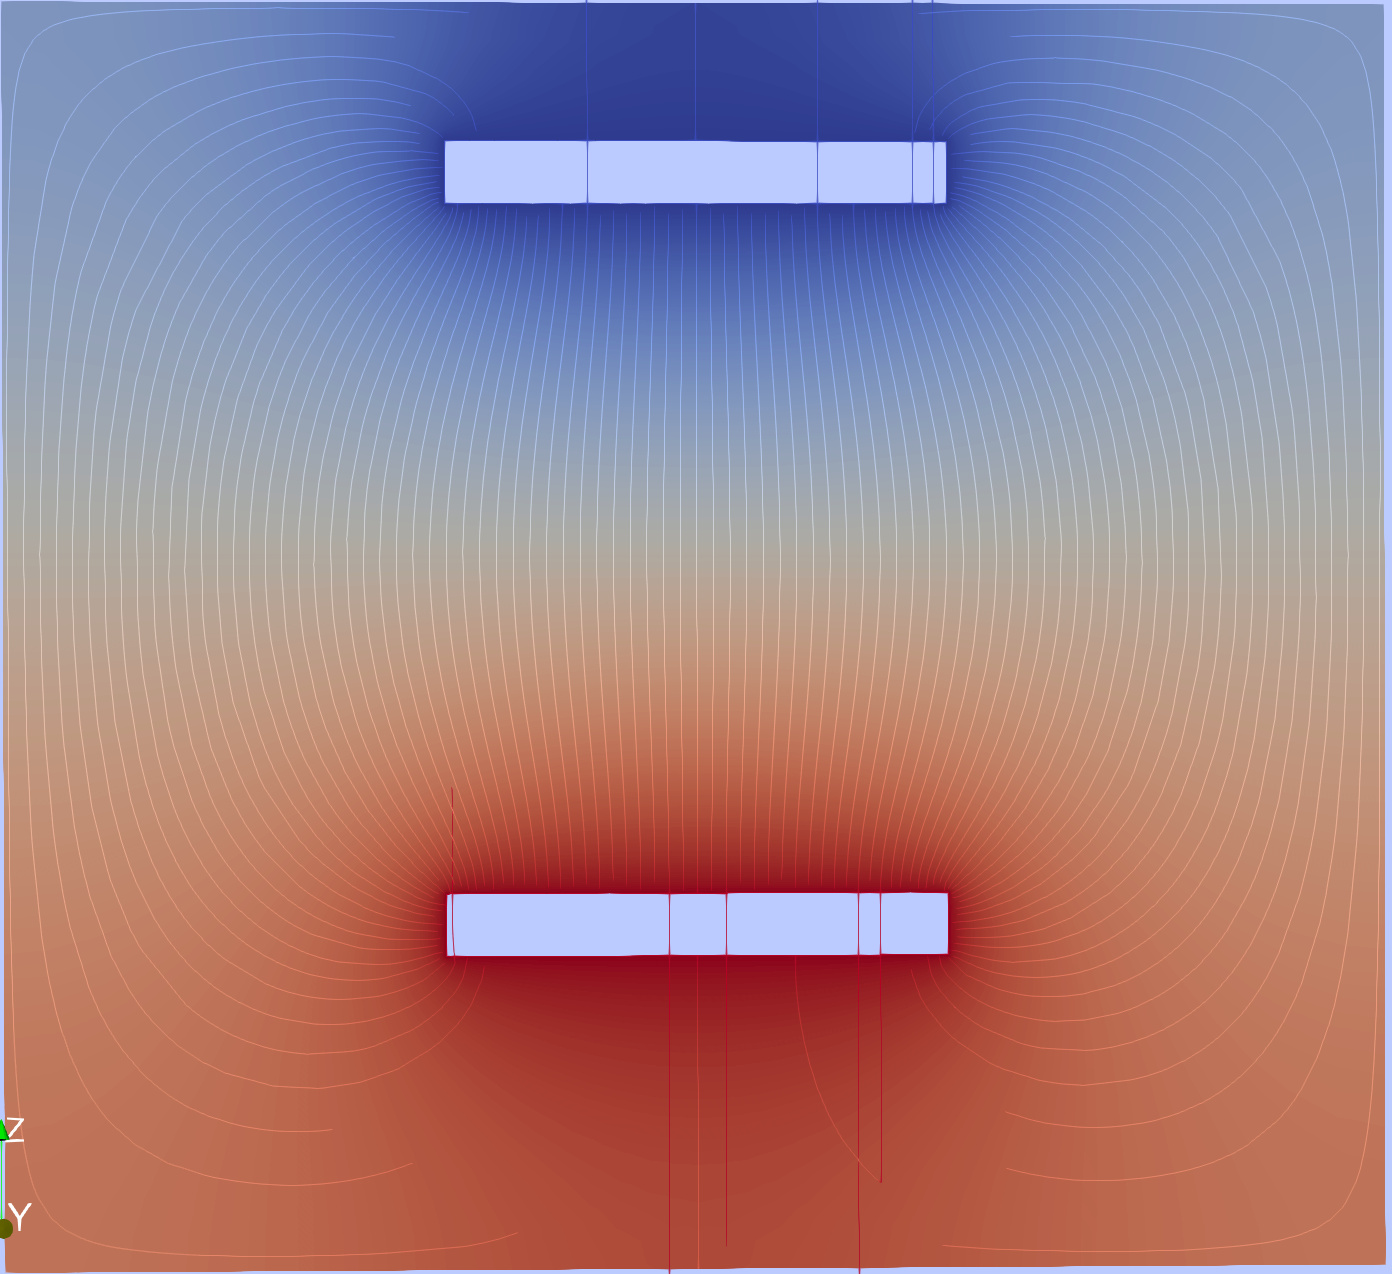
I have been using ParaView for visualizing the electric field map (geometry modeled with Gmsh and field solved with Elmerfem). My test case is just parallel disks with a certain voltage inside a box of air. Since the system is cylindrically symmetric I am just interested in seeing the field lines in 2D. For this I slice my cylinder with the homonym filter, plot the potential contour, then use the filter “Gradient of unstructured data set” (to calculate the E field, since what I actually have is the potential), and finally use the stream line tracer filter in the 2D plane that i chose.
Everything looks almost perfect, except for some strange lines originated in both plates, that have no physical meaning, and I don’t know what they are or how to get rid of. (see attached image)
Does anyone know what is going on? I appreciate your comments.
Cheers!
Sabrina