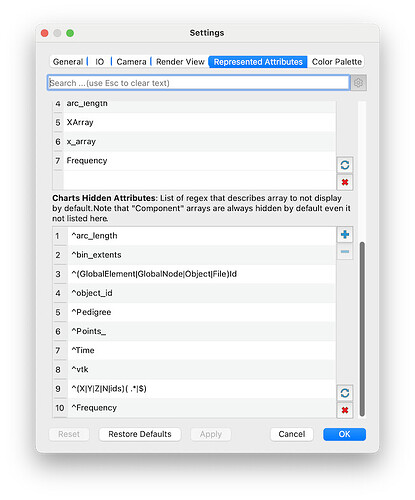
Paraview has an option to hide some arrays via Filters Expressions in settings. Is there a way to do the same in the table for charts? It is possible to control visibility of charts, but is there a way to hide arrays from the table, just like color array? Maybe it is possible programmatically via C++?
