Hello, I have been using ParaView for three months.
I am currently loading an Ensight file and working on the visualization of the aorta, the forward and backward flow.
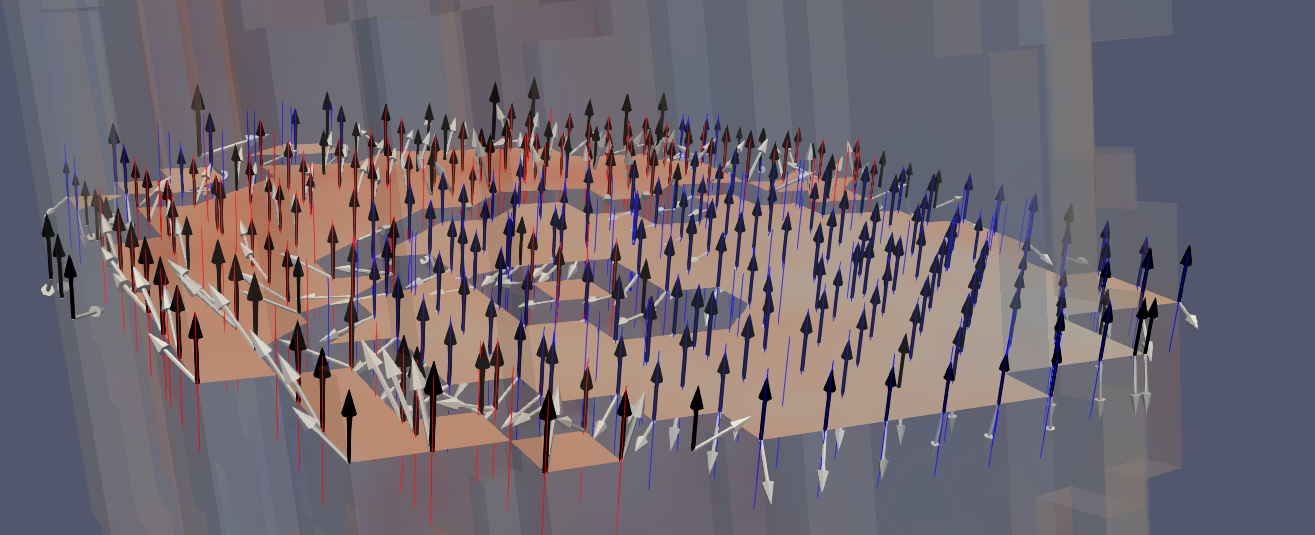
I separated and visualized the forward and backward flow by computing the dot product of the normal vector (black) of the slice and the 3D velocity vector (white) using calculator filter.
If the result is greater than zero, it is shown in red(forward flow); if it is less than zero, it is shown in blue(backward flow).
I sliced the aorta into multiple sections and applied this method to all of them.
However, that visualization is simply based on the separated sections of slice using glyphs. I want to map the separated flow back into the actual velocity vector voxels. In other words, I want to visualize it as if I were viewing the velocity vectors using volume rendering. Is there a way to achieve this?
Thanks for reading. Thank you for your help!
No, volume rendering works like the image above. I mean, I can’t tell if the speed of that volume rendering flows forward or backward. Looking like volume rendering, I want to distinguish between front and back flows.
What you see in volume rendering is the speed of blood flow. Start from the left, go up, go past the arch, go down. This mean forward flow. But this flow doesn’t just go in one direction.
If you can define the “black” vector at each point of the entire image, you could create two calculators/programmable filters, one for each type of flow.
Then you can apply Glyph to each of them and color then as you wish.
Is your slice always aligned with one of the axes ?
Ok, it is good though that it is along an arc. If you have an analytic description of the arc and you can define the vector at each point then you should be able to create a programmable filter to do what you want right ? Or am I missing something ?