Generate graph for Ahmed Body

Hello,
I am a beginner in paraView and currently I am interested in the post-Processing for Ahmed Body Simulation.

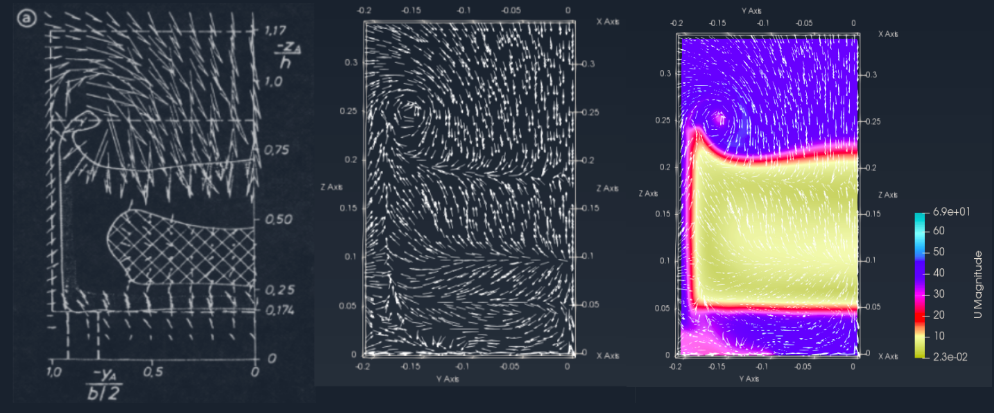
I want to plot the similar graph for my simulation as attached below. Can someone please guide me how to do that?
Here the x axis represents the stream wise direction, z represents the cross stream direction and velocity field is plotted. I am not aware how to do this. Can someone please guide.

Reference: Left most diagram is from Ahmed Body paper.
Right most diagram is from https://www.cfdsupport.com/ahmed-body-tcfd-benchmark.html

Thank You

Looks like Slice filter + Glyph filter should for the trick.

Sir i tried it already. The problem here is that the X-axis and Y-axis represents the stream-wise and span-wise direction is there and then velocity field is represented here. I certainly don’t know how they are doing this? I want to generate the third graph (colorful one) and i am not able to do that.
Thank you

Please share your data.

Sure Sir, Please find the drive link where i have uploaded the VTK file. Sorry for my late reply. The uploading took most of the time.

Thank You

stream.pvsm (1.1 MB)

1 Like

Sir I was able to generate this but i want the exact same graph which was shown in the above picture (The colorful one).

You may want to try for yourself then.

Okay Sir. Thank you so much

Hello Sir,

Could you please guide how did you do extract selection after creating slice?
Thank You

I’m not extracting anything, but you would use Extract Selection for this task, after performing a selection of course.

You may want to read the ParaView guide:
https://www.paraview.org/paraview-guide/

Or at least the getting started:
https://www.paraview.org/download/