I’m new in ParaView and have been trying to optimise the development of a 3D implicit model.
I have created a CSV file that contains two different surfaces, and the objective is to generate a volume from these surfaces. I have attempted to use the
Delaunay 3D filter; however, the program crashes each time I run it. This may be due to the dataset being quite large or complex.
I have uploaded the CSV file in case anyone is able to help with this issue.
Thanks in advance for your support.
So you will need to generate .csv file with the correct content.
Alterantively, you should consider not using .csv to describe 1M points, and instead use a more efficient format which stores the totpology as well. .vtkhdf, .vtr or .vtk comes to mind.
The CSV file contains two different surfaces that share the same X and Y coordinates but have different elevation values.
I understand that handling around one million points can be challenging. Do you know how to convert a CSV file into VTK format? It seems that this format is more natively supported and better suited for use in ParaView.
I am assuming these data, are being generated by some numerical model. If so, is there any chance you can request a binary format? CSV is probably the worst format you could work with. Can you output netcdf?
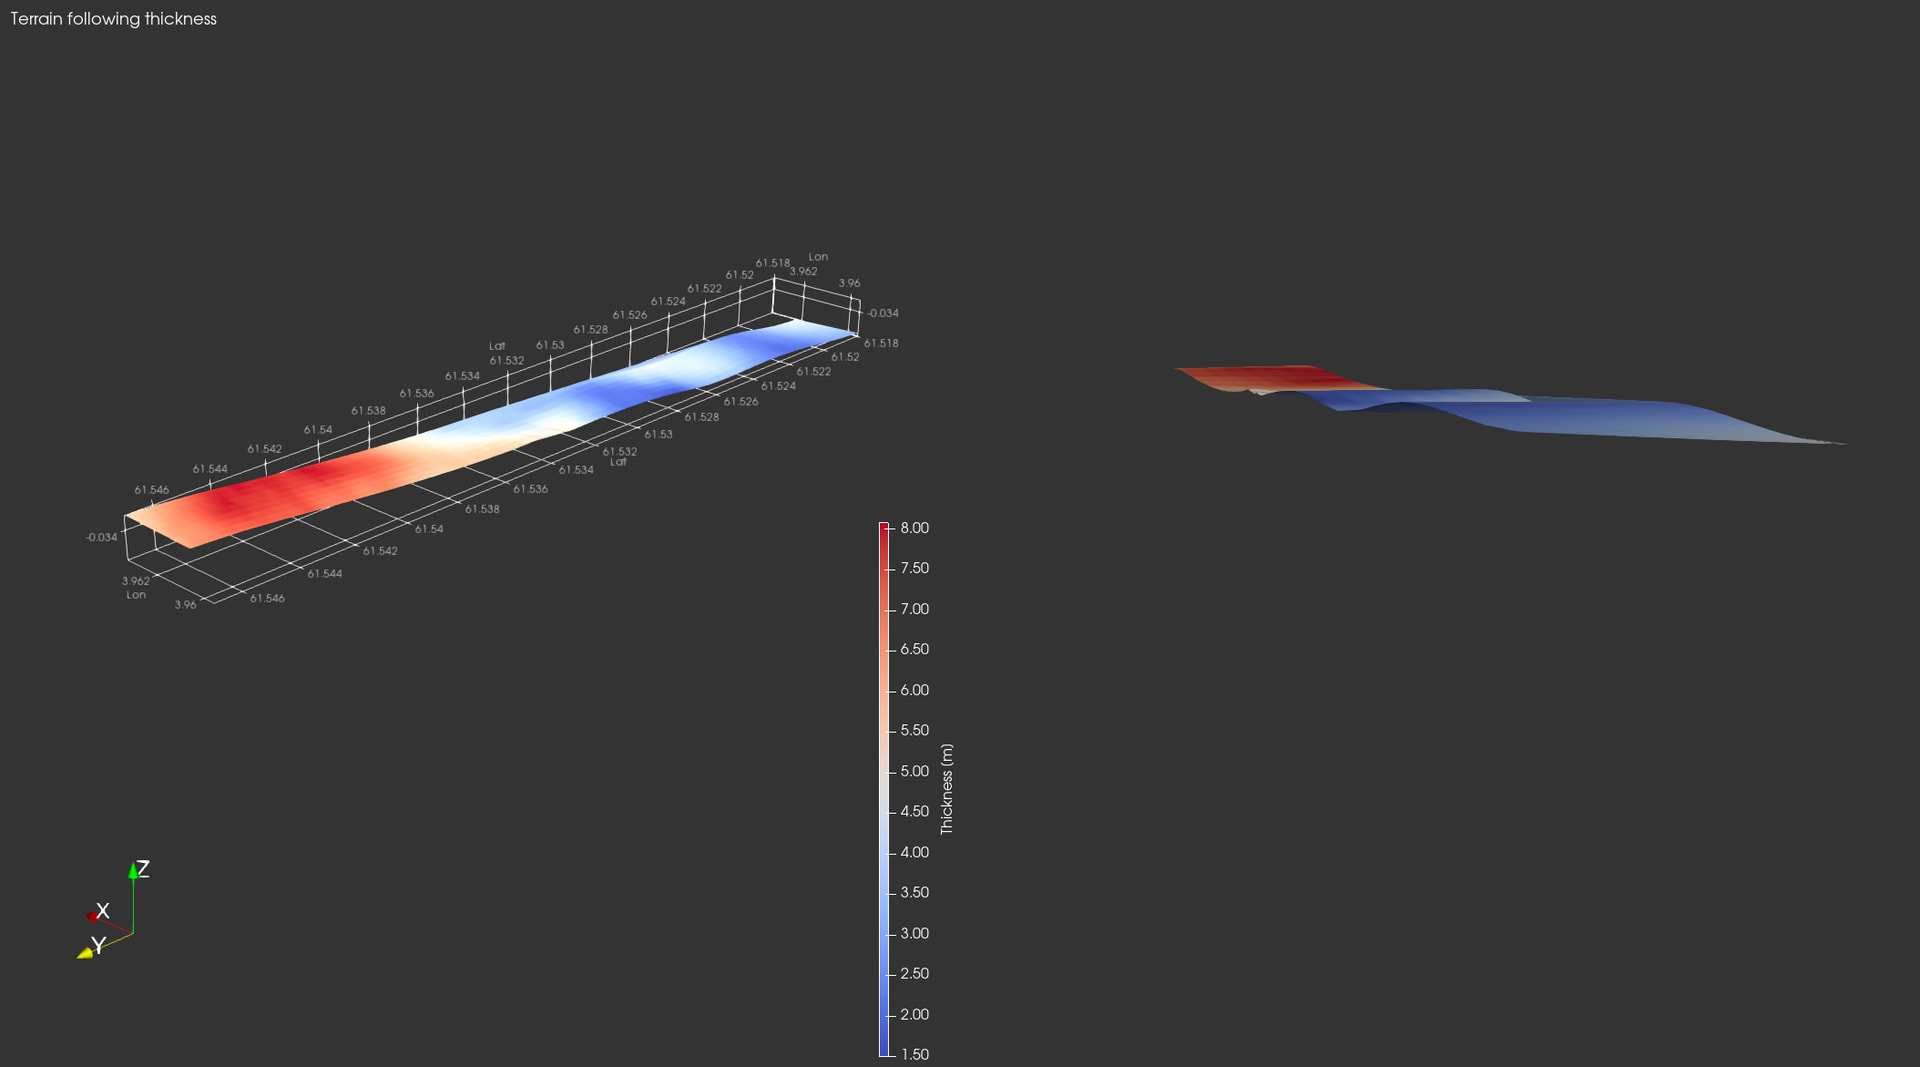
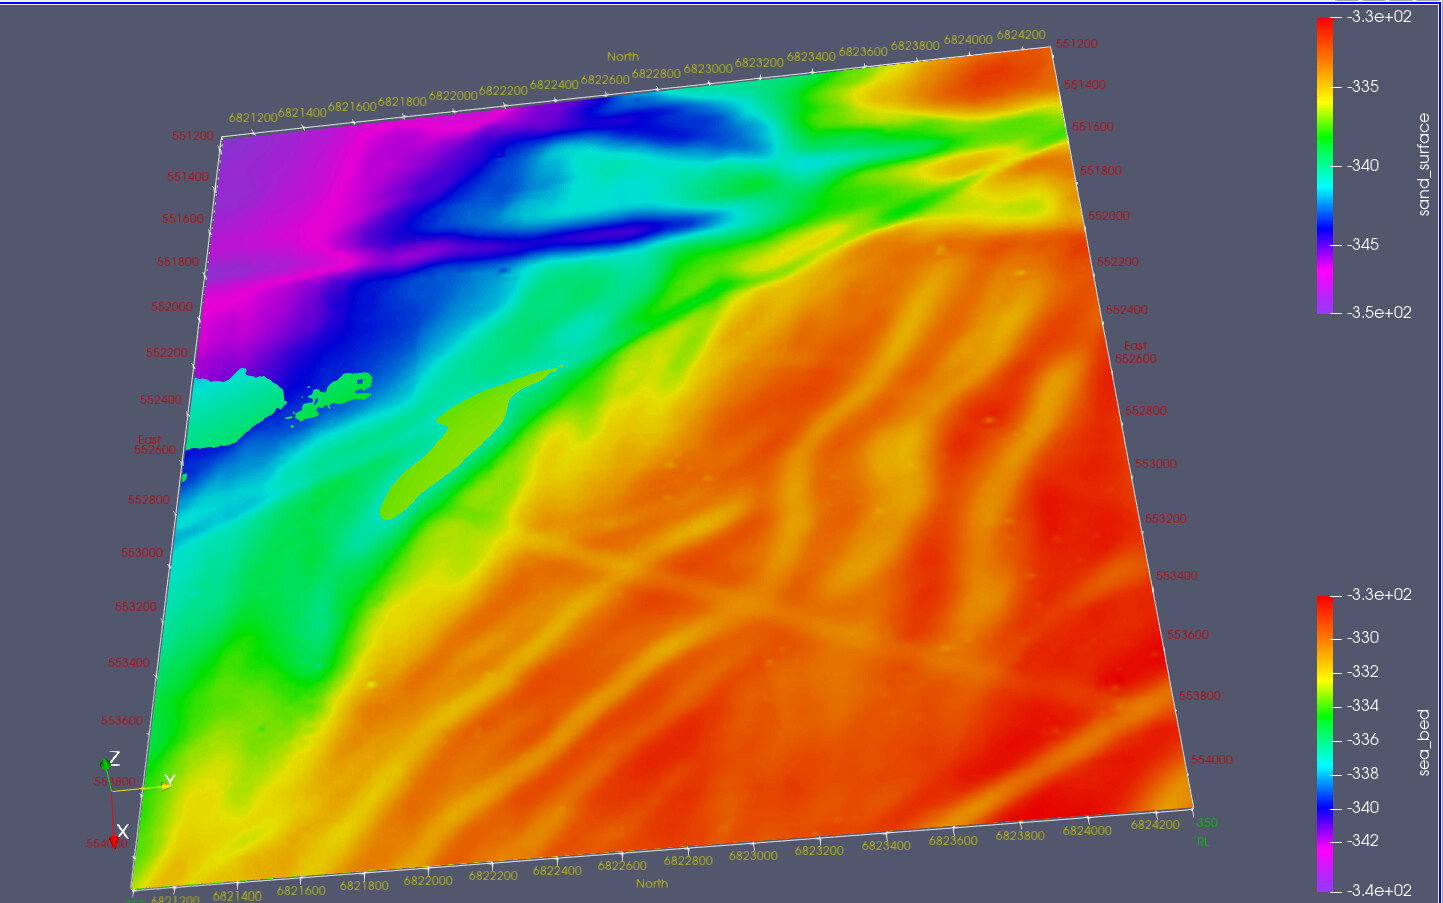
I tried pre-processing your data, in python, and converting to a vtk file. I enclose what the first 5000 point look like. As you can see the surface is terrain following (i.e. following sea bed) and showing sand thickness.
A direct binary output would greatly simplify things, also allowing some more advanced option (like extruding and/or stacking vertical bins for each layer, in case you have multi-layered outputs.)
Brief follow-up, I have tried converting it to netcdf, avoiding loops and vectorizing (so I could use GPUs). I have built gridded data by interpolating sand and seabed surfaces onto a regular grid using IDW with KDTree acceleration. That is: a KDTree spatial index for each layer to enable fast nearest-neighbour queries from grid points to scattered geological measurements. This avoids O(N²) distance computations and reduces interpolation to efficient O(N log N) searches per surface. The sand thickness is computed as the difference between the two interpolated surfaces, with negative and poorly constrained values masked. The final output is stored as a NetCDF dataset.
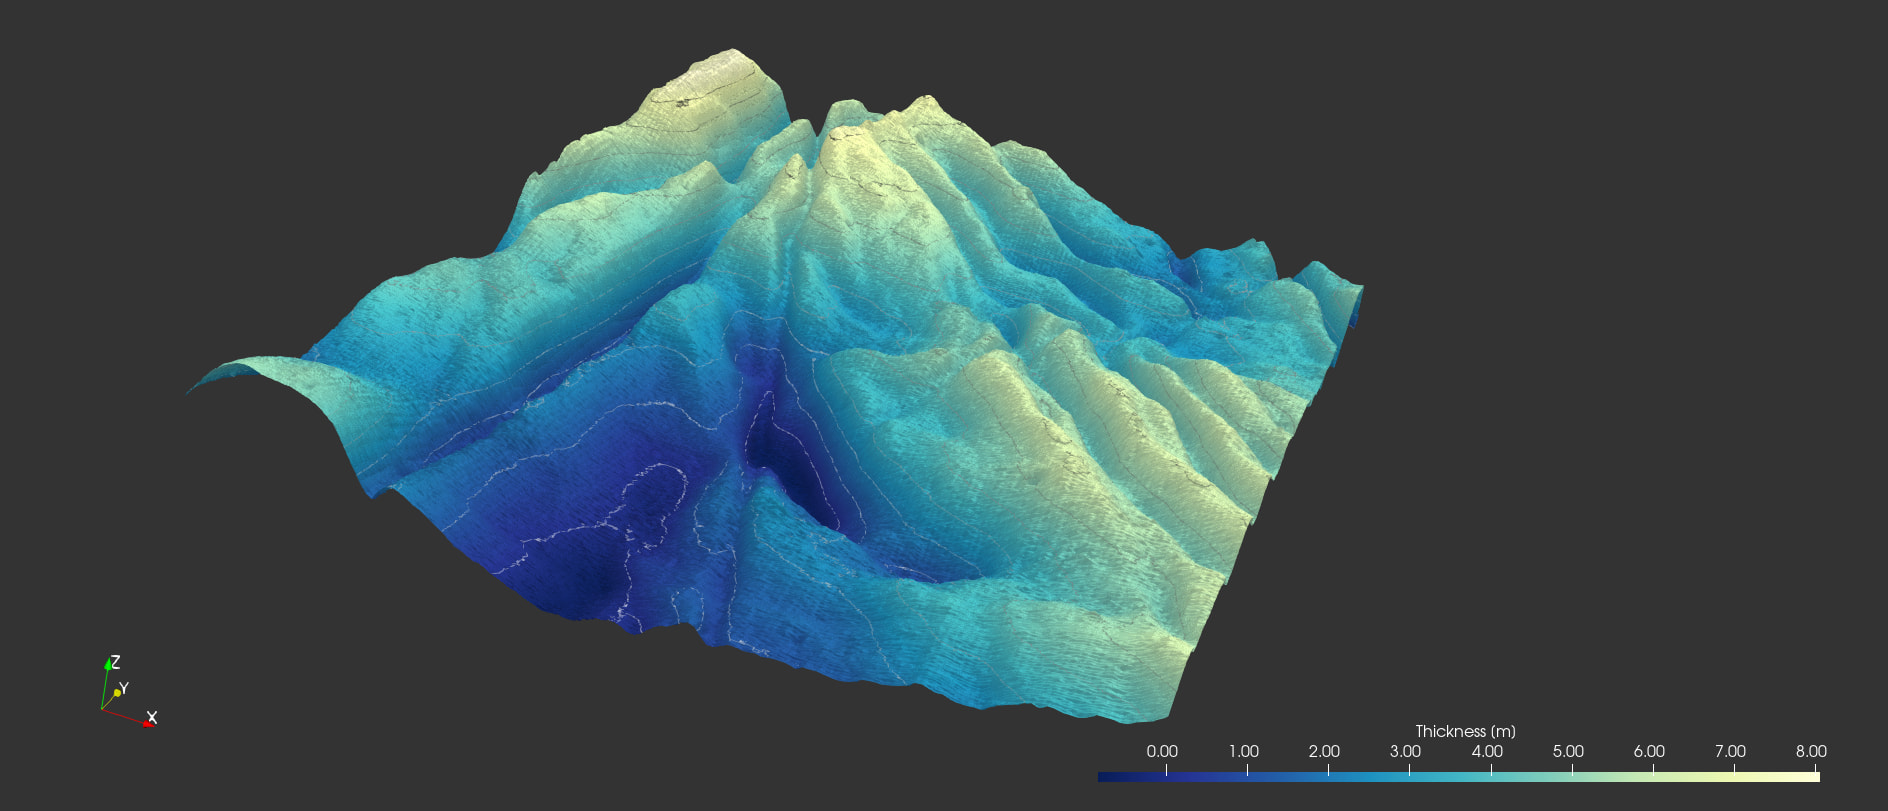
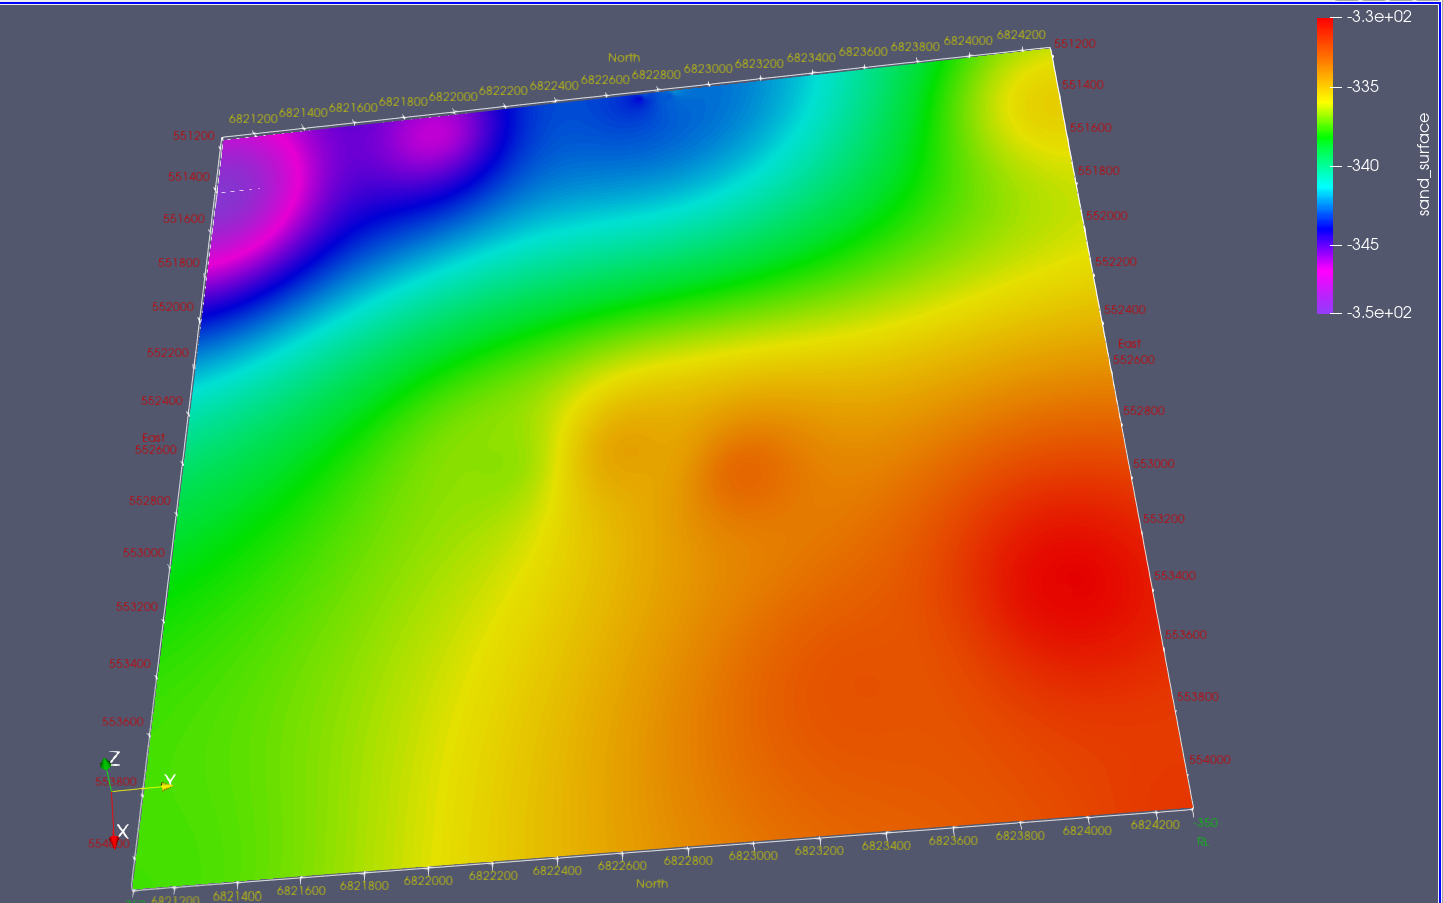
Vicman. I make it 34,175,438 m^3. Without going to PV although I’ve also done that for the exercise. My workflow was to grid the sand surface and the sea bed separately using a minimum curvature algorithm which is part of a geophysical data processing suit I wrote but could equally be any gridding package - e.g. QGis/Surfer etc. The data were on a regular 1m x 10m grid for the sand and 1m x 20m for the sea bed so could have been loaded into PV and had a points to structured grid attached but the sort order was wrong so the surfaces would have sat vertically. I then subtracted the sand layer grid from the sea bed grid to produce a sand thickness grid, Summed the values and multiplied by my grid cell size (5m x 5m) to get the answer above. I’ve written a suit of tools to take geophysical and geological data into a format PV can read so converted the two grids to vtk files and imported into PV. I attach a couple of screen shots which without the vertical exaggeration of GEA’s presentation look pretty dull and its hard to see the separation which varies from ~0 to ~8m. The ASCII vtks are each 24Mb so I won’t attach them but you are welcome to them if you want.