Hello,
I have a 3D domain specifically a engine comprising of piston, cylinder and cylinder head…i can get the contours of every variable on slices at different positions throughout the domain…what i want is to technically transfrom that data from 3D to 2D. meaning i want to get the average of the whole domain over a slice say on XY plane (neglecting Z), the same case for accumulated values…Lets say I want to get the average/accumulated temperature of whole domain on a 2D slice, rather than the instantanous value slice gives at the specific position… Is their a way to do that…any programmable filter
Hello,
I am sorry because i didn’t understood properly what you said…first how can i calculate average or accumulation of whole domain over that slice !!! does calculator allows this to do Accumulation/ averaging over a plane!! or any programmable filter would be used!!! can you please elaborate a bit…thanks
yes…but as an average or as the accumulation of whole domain!..so that I can get a contour of average or accumulated i.e., mass of say CH4 in the whole domain represented in a 2D XY contour…
As an exmaple, here is the file Dropbox - post000054_+3.64012e+02.h5 - Simplify your life
I want to get Accumulated or Average mass of OH of whole domain in a XY plane…
for that first I used calculator to get Mass of OH from mass fraction
then now the task is to make a slice and project accumulated or average mass of whole domain over it…
I have been trying to use transform command but making Z=0, but I think it does not make sense.
used a few programmable filters but not working…for example the following finds projection on a plane at location z=-20… but am not sure its sum of domain…
# Programmable Filter
# vtkUnstructuredGrid
# ------
output = self.GetOutput()   # different output type => different code
numPoints = inputs[0].GetNumberOfPoints()   # also inputs[0].GetNumberOfCells()
side = round(numPoints**(1./3.))
layer = side*side
rho = inputs[0].PointData['MASSFRAC_OH (partial)']        # also inputs[0].GetPointData().GetArray('MASSFRAC_OH (partial)')

points = vtk.vtkPoints()      # create points instance, to contain 100^2 points in the projection
proj = vtk.vtkDoubleArray()   # create the projection array
proj.SetName('projection')
for i in range(layer):        # loop through 100x100 points
    x, y = inputs[0].GetPoint(i)[0:2]
    z, column = -20., 0.
    for j in range(side):
        column += rho.GetValue(i+layer*j)
    points.InsertNextPoint(x,y,z)        # also points.InsertPoint(i,x,y,z)
    proj.InsertNextValue(column)         # add value to this point

output.SetPoints(points)                 # add points to vtkUnstructuredGrid
output.GetPointData().SetScalars(proj)   # add projection array to these points

quad = vtk.vtkQuad()        # create a cell
mesh = vtk.vtkCellArray()   # create a mesh with 99x99 cells in the projection
for i in range(side-1):
    for j in range(side-1):
        quad.GetPointIds().SetId(0,i+j*side)
        quad.GetPointIds().SetId(1,(i+1)+j*side)
        quad.GetPointIds().SetId(2,(i+1)+(j+1)*side)
        quad.GetPointIds().SetId(3,i+(j+1)*side)
        mesh.InsertNextCell(quad)     # insert a cell with four vertices

output.SetCells(vtk.VTK_QUAD, mesh)   # add mesh to vtkUnstructuredGrid
Hello everyone, i have been trying to tackle the problem of getting average over slice. i think now I have the recipe but don’t know exactly how to make it work as I am new to paraview…Attaching the script here which can be run from python shell on file I uploaded on dropbox TRYPOINTH.py (15.0 KB)
So, here it goes..I create first slices at specific locations in Z direction and then I transform each slice at one location that is actually origin. My first issue is I want to define the positions of slices automatically not manually as I did in script.
i tried to define by:
import numpy as np
z = np.linspace(0,max(inputs[0].PointData[‘coordsZ’]),20)
but it ain’t working , says not defined…Actauuly I don’t get it how to access the variables array that are in paraview through python shell. First can anybody tell me this??
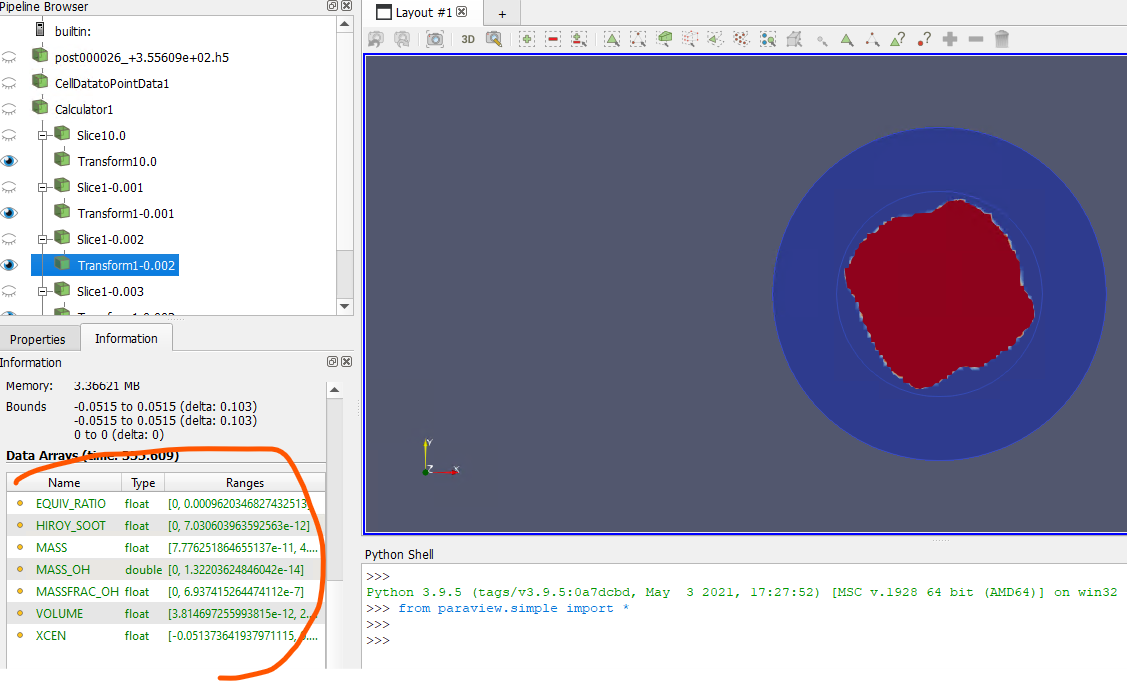
Second now I have data of my quantity at each transformed slice, I want to do average ..i tried but in vain…through line 250..again I am not sure how to access the data in array present in information column in paraview through pyhton shell or script (data in attached pic)
# programmableFilter1 = ProgrammableFilter(Input=transform1)
# programmableFilter1.Script = """
    # input0 = inputs[0]
    # input1 = inputs[1]
    # Uavg = input0.PointData["MASS_OH"]+input1.PointData["MASS_OH"]
    # #Getting number of points
    # numPoints = input0.GetNumberOfPoints()
    # newPoints = vtk.vtkPoints()
    # for i in range(0, numPoints):
    # coord = input0.GetPoint(i)
    # x, y, z = coord[:3]
    # x = x*1
    # y = y*1
    # z = z*1
    # newPoints.InsertPoint(i, x, y, z)
    # output.SetPoints(newPoints)
    # output.PointData.append(MASS_OHA,"MASS_OHA")
# """
So, can anyone help me in this regard, like I have transformed the data, now I just need to average it …accumulation too but I can do that later..
Appreciated.
Accessing variable arrays, etc., is possible by using servermanager.Fetch to retrieve the corresponding vtk object. (However, servermanager.Fetch does not work well with Partitioned Dataset Collection data, so the data must first be converted to an unstructured grid using the Merge Block filter.)
For example, to extract the minimum and maximum z-coordinates using servermanager.Fetch, the code would be as follows:
Hello, Yoshimi, your technique of creating the box works in terms of getting the outbounds of geometry. Thanks for that!!! if you have any recommendations about averaging all data, I would appreciate that!!! I also included the programmable filter that I use but it ain’t working.
Thanks
If I understand correctly, you are trying to compute a partial average of field quantities of three-dimensional data. This can be expressed as a partial integration: