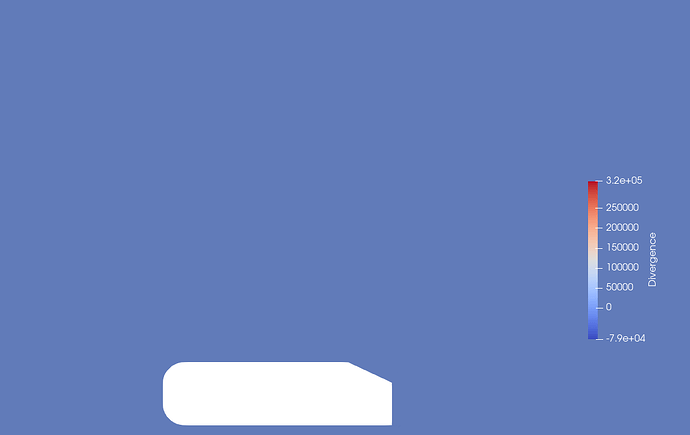
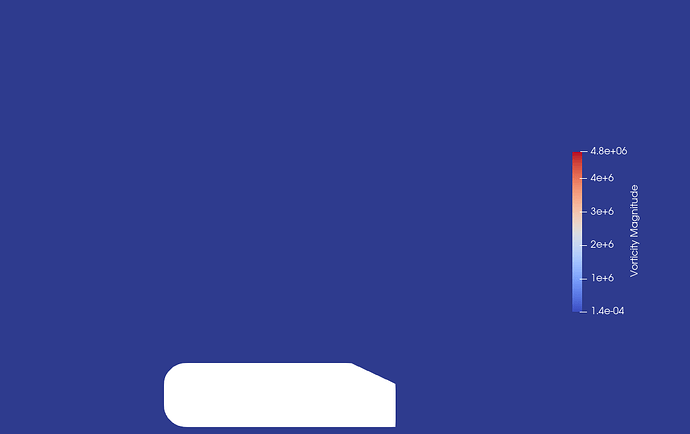
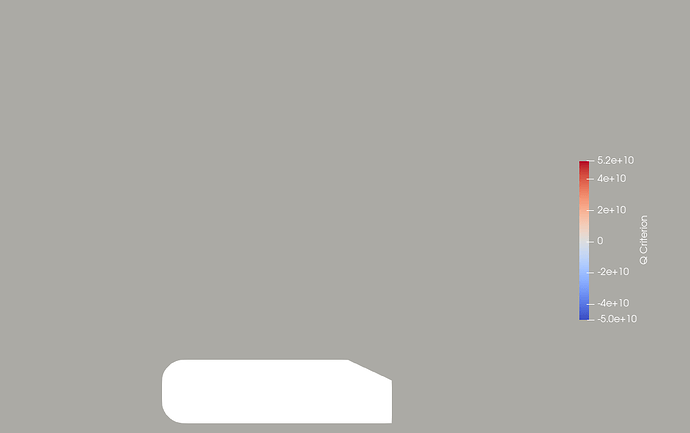
I have the flow over an Ahmed Body in 2D and when I apply the Gradient filter to visualise the vorticity and Q criterion I get these results:
I am not exactly sure what I’m missing; it seemed pretty straightforward from a tutorial I saw on YouTube.
Any help would be appreciated.
Thanks in advance!
Edit: I tried applying a contour filter and used the Q-criterion as the “Contour-by” and the flow field seemed to vanish.
cory.quammen
August 2, 2024, 12:21pm
2
Is it possible for you to share your dataset?
That’s fine. I ran the simulation in Openfoam.
Do I just send the state file or do I need to send the results folder?
cory.quammen
August 2, 2024, 12:31pm
4
The results folder is necessary, and the state file if you wish, though that is less important.
Ok, thanks.
Here is a link to access the folder:
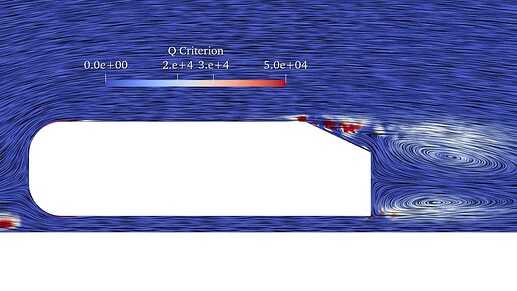
The Q criterion and other similar metrics have large absolute values in the boundary layer, but in other areas, they are negligible and do not show up as contour changes. By rescaling to a custom range
1 Like


