It may be just a semantics problem, but I can’t find how to turn on grid labels. I’m viewing a blockMesh grid (not a complete solution), and I was wanting to be able to display distance (position in x/y/z space) of each grid point on the mesh. I got as far as trying ticking “Axis Grid” in “Display” and some lines/ticmarks appear, but no annotation of the locations of the points. I seem some settings that appear to be meant for annotations (i.e., scientific notation, fixed point, etc.) but these don’t show up in the display.
Anyone? The only way I’ve been able to get point locations is the hover-tool.
Hi PattiM,
Welcome to the ParaView discourse site, and the ParaView community!
With regards to your question, many folks that frequently read these pages are out on vacation for Christmas/ New years. Thus, why you are probably not getting a reply.
With regards to your question, I have to admit I am confused. Could you give an example? Either a trivial dataset, with clear directions what you are looking for, or use Sources/ etc. For instance, Sources/ Point. Put the point at 0.5, 0.5, 0.5. I want to display the X, Y and Z location of this point on screen.
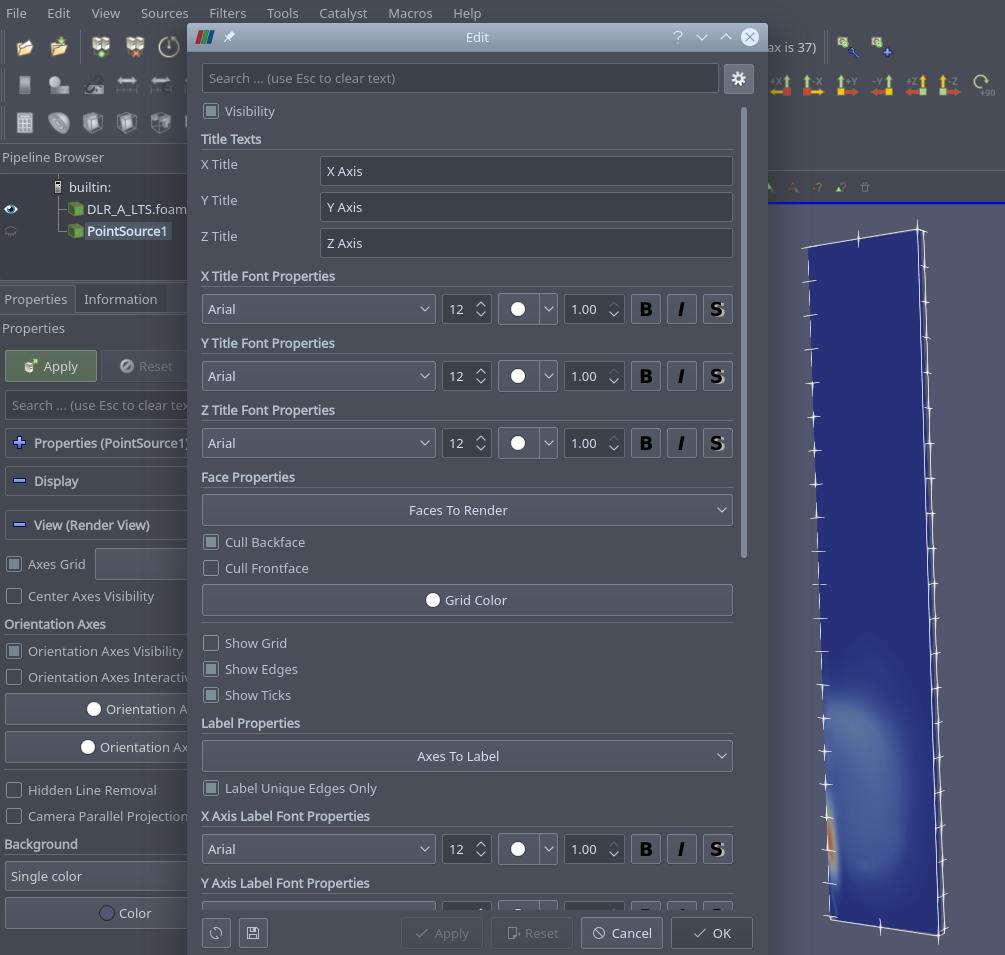
Thanks for the reply. I uploaded a screenshot - I loaded a OF combustion case into paraFoam - and I can display flow/chemistry variables, and I can get the dimension tic marks to show up but they are not labelled with dimensions, and the axis labels don’t appear either. (I left included in the screenshot the options I selected.) Maybe there are other settings (such as “Sources” you mentioned) which need to be set for the x,y,z domain dimensions to be displayed.
@utkarsh.ayachit @cory.quammen Hi guys, I couldn’t figure out how to do this. Is this a feature hole? I even tried Source/ Point, Select, View/ Selection inspector, and could not annotate the point locations. Is this a feature we should add? If so, I will write it up.
@PattiM, to track down what the issue is exactly, mind doing the following:
- launch ParaVIew with the
-drcommand line argument e.g.paraview -dr. - Create
Waveletfrom sources menu, Apply. - now check Axes Grid from the Properties panel. You should see something like the following, are you not seeing the labels?

Well, that’s what I’m looking for - but “wavelet?” Well, anything is worth a try. 
Thanks!

I guess I’m still doing something wrong.
Did you really used -dr flag ?
Can you try ParaView from our release instead of the version you are using ?
https://www.paraview.org/download/
Which linux distribution are you using ?