Hi,
I have been working with Paraview for the visualization of 2-phase flow. For my research purpose, when I apply a specific contour, I obtain sets of points known as interfaces (like the image below- there are points in the image not lines):
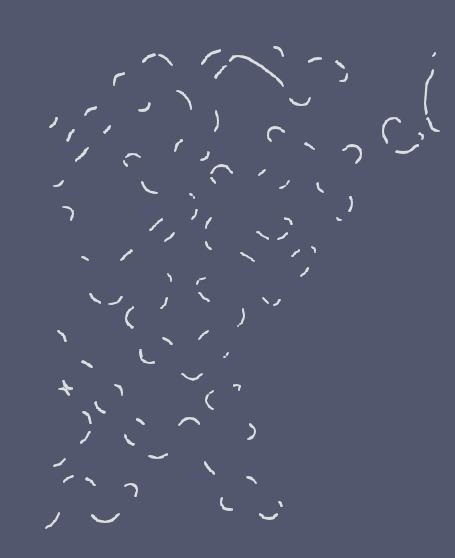
However, when I read csv file of these data points in Python and try to do some analysis, the ordering of the points run into a problem and become unorganized, and for example for one specific interface of the above image, the curve looks like this:

So, I wanted to ask how I can do the ordering of the points in each interface (each white segment of the first image), so they create a curve (in Python) without the lines intersecting each other?
Looking forward to hearing from you.
Foojan