You mean choose 3D Glyphs representation and use scalar vector to set color?
if not this case, please give me more details.
In my requirement, i also need to visualize the density of the points, i am using vtkPointDensityFilter to calculate density value, but this will generate a vtkImageData, i need a volume representation to visualize the result?
Any suggestion, if i want to know density of each origin point?
I will have a try, by the way, do you know why Point Gaussian can visualize large number of point in Sphere format, but with very high performance, while my meshed many spheres have very bad performance.
I followed your instruction, generally i got the result, but there are two problems:
<1> the first problem
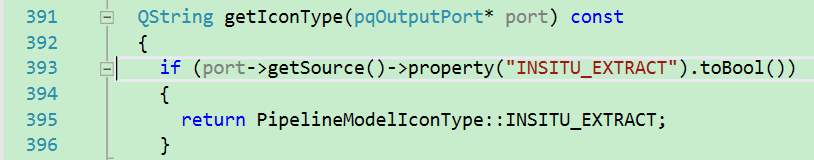
I create myPointerDensityFilter which inherited from vtkPointDensityFilter, then write filter proxy in XML file, it works. but when i exposed some properties in the xml, program will crash at class “pqPipelineModel” line 393: it is show the source get from port is NULL
<2> the second one is when i use RessampleWithDataSet, my Destination Mesh is a vtkMultiBlockData, this is supported or not? because when i do this, program become dead, dont know what’s the reason…but i haven’t try if convert it into vtkPolyData. Any ideas?
This two issues are solved.
First one is because i made a mistake that use “doubleVector” for “int” value, after correct this, there is no crash.
For second one is also fixed after select right source and target mesh. Source should be density, and target mesh should be origin data point.