Dear ParaView Community,
I hope this message finds everyone well. I am reaching out to seek guidance on a challenge I’ve encountered related to animating time series data in ParaView. Despite consulting the official ParaView tutorials and various YouTube guides, I’ve been unable to find specific instructions for dealing with animations where the data is stored in folders named after time series, similar to what I’m working with.
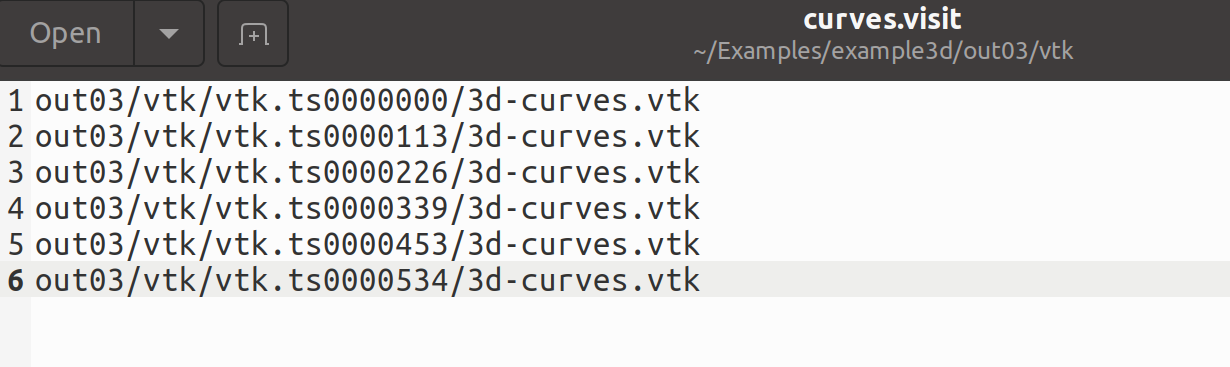
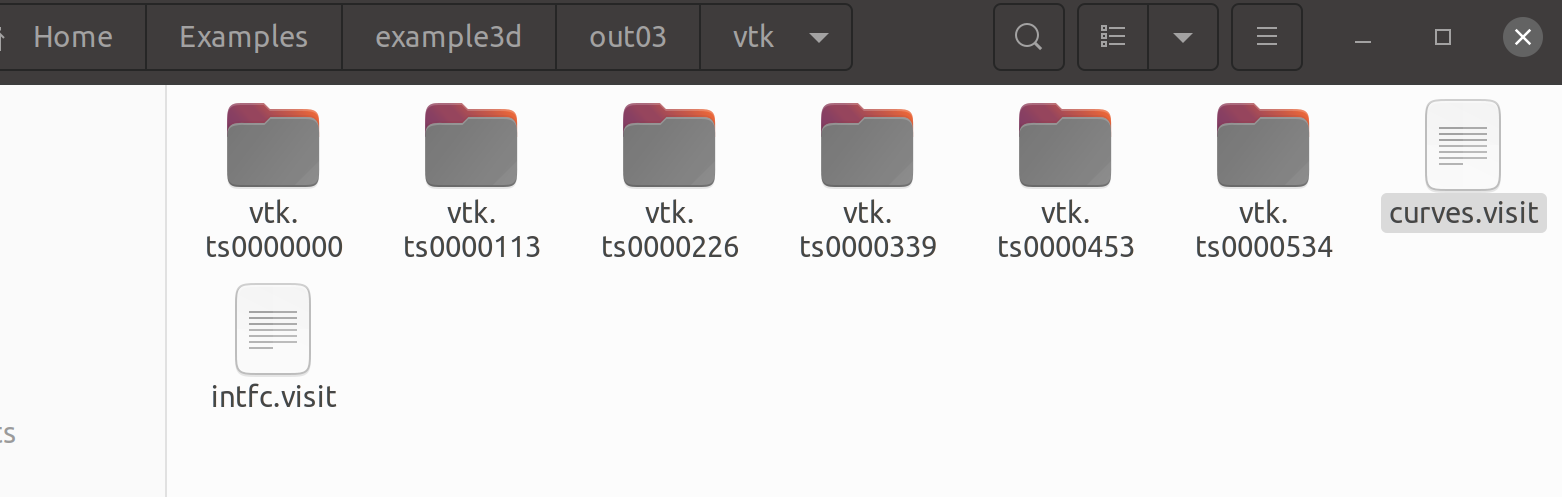
In my initial attempts, I tried to use a .pvd file to open the animation, but ParaView crashed immediately upon doing so. In the data directory, I noticed two .visit documents, named sequentially by time. I hoped to have ParaView automatically recognize these files and animate them based on their timestamps, but I couldn’t find an appropriate reader for the .visit files.
From what I’ve seen in several tutorial videos, it seems common to open time-sequenced VTK documents in ParaView using a .group file. I’m wondering if I need to create a .group file to facilitate the animation process, or if there might be a more straightforward method to generate the animation directly with an appropriate reader.
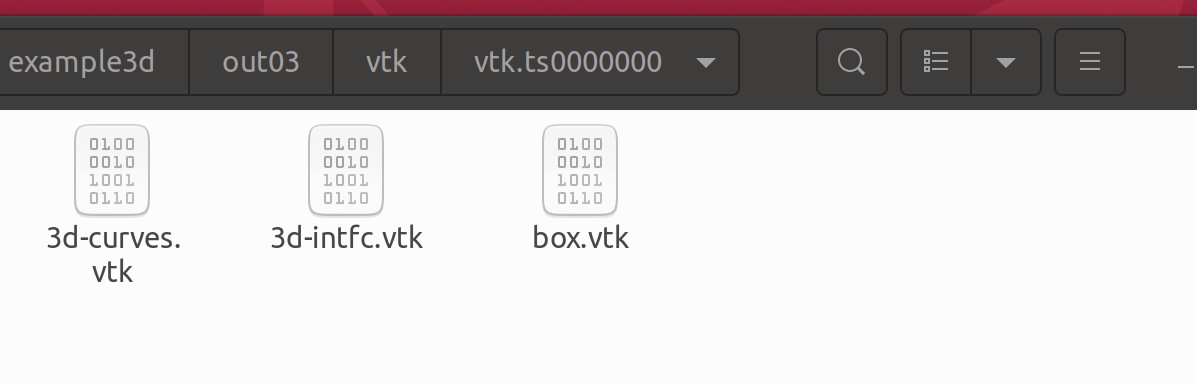
Additionally, I have experimented with opening vtk files directly (e.g., vtk.ts0000000 and vtk.ts0000005), attempting to group their contents into separate datasets. While the data in each group differs, initiating playback did not change the visualization as expected. I’m uncertain if applying specific filters or adjusting the time series in a different manner could help in generating the desired animation effect.
Could anyone please provide insight or guidance on how to properly animate time series data stored in this manner? Any suggestions on the correct approach to reading .visit files or advice on whether a .group file is necessary (or if there’s an alternative method) would be immensely appreciated.
Thank you in advance!