Hi there,
I try to visualize geological cross sections using Paraview. For this, I create a *.vts using pyvista and then use the filter textureMaptoPlane. In the following I will give you an example with pyvista, and then show you my issue in Paraview.
I will use the this free image from the web for the demonstration:

- Creation of the cross-section support from pyvista:
from pathlib import Path
import numpy as np
import pyvista as pv
from numpy.typing import ArrayLike
def make_cross_section_surface(
section_xy_sequence: ArrayLike, section_z_min: float, section_z_max: float) → pv.StructuredGrid:
"""

Make a structured grid as a 3D support for a geological cross section.


Parameters

----------

section_xy_sequence : ArrayLike

    Coordinates x-y of the points defining the cross section surface line.

section_z_min : float

    Minimum value of the cross section on the z-axis.

section_z_max : float

    Maximum value of the cross section on the z-axis.


Returns

-------

Tuple\[pv.StructuredGrid, np.typing.NDArray\[np.float64\]\]

    A pyvista stuctured grid with embedded texture coordinates that can be exported

    and saved as a \*.vts for vizualization in Paraview.

"""

\# --- Step 1: Define the surface grid in 3D space ---

\_section_xy_sequence = np.asarray(section_xy_sequence)

n_points = \_section_xy_sequence.shape\[0\]

n_z = 2  # bottom and top of the section

\# Create grid coordinates

X = np.tile(\_section_xy_sequence\[:, 0\], (n_z, 1))

Y = np.tile(\_section_xy_sequence\[:, 1\], (n_z, 1))

Z = np.vstack(\[np.full(n_points, section_z_min), np.full(n_points, section_z_max)\])


\# --- Step 2: Create structured grid (rectangular surface)

surf = pv.StructuredGrid(X, Y, Z)


\# --- Step 3: Define texture coordinates ---

\# u varies along the section (0 to 1)

\# v varies vertically (0 to 1)

u = np.linspace(0, 1, n_points)

v = np.linspace(0, 1, n_z)

uu, vv = np.meshgrid(u, v)


\# Flatten in the same order as the structured grid’s points

uv = np.c\_\[uu.flatten(order="F"), vv.flatten(order="F")\]


\# Embed the texture coordinates

surf.active_texture_coordinates = uv

return surf
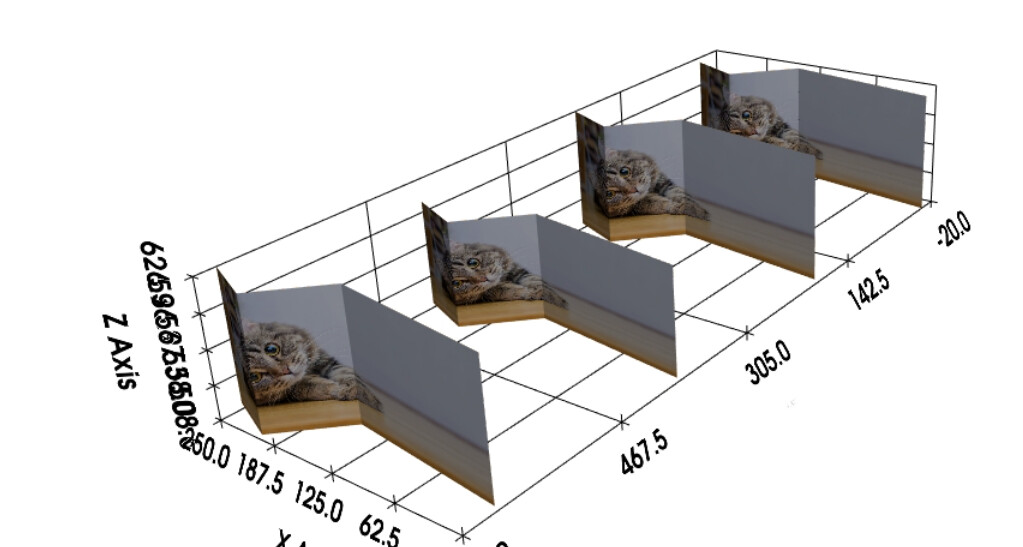
Here is an example where I plot 4 cross sections. Everything works like a charm with pyvista:
# Test
image_path = “kitty.jpg”
xy = np.array([[0.0, 0.0], [150.0, -20], [200, 30.0], [250, 10.0]])
xy_seq = [
xy,

xy + np.array(\[0.0, 200.0\]),

xy + np.array(\[0.0, 400.0\]),

xy + np.array(\[0.0, 600.0\]),
]
z_min_seq = [508.6, 513.6, 512.7, 513.6]
z_max_seq = [621.3, 626.3, 606.3, 626.3]
texture = pv.read_texture(image_path)
plotter = pv.Plotter()
for i, (section_xy_sequence, section_z_min, section_z_max) in enumerate(zip(
xy_seq, z_min_seq, z_max_seq)):
\# Make the cross section

cross_section_surf = make_cross_section_surface(

    section_xy_sequence, section_z_min, section_z_max

)

\# save the image

cross_section_surf.save(Path(image_path).stem + f"\_{i}.vts")

\# Add to the plotter

plotter.add_mesh(cross_section_surf, texture=texture)
plotter.show_grid()
plotter.show()
This is what you have:
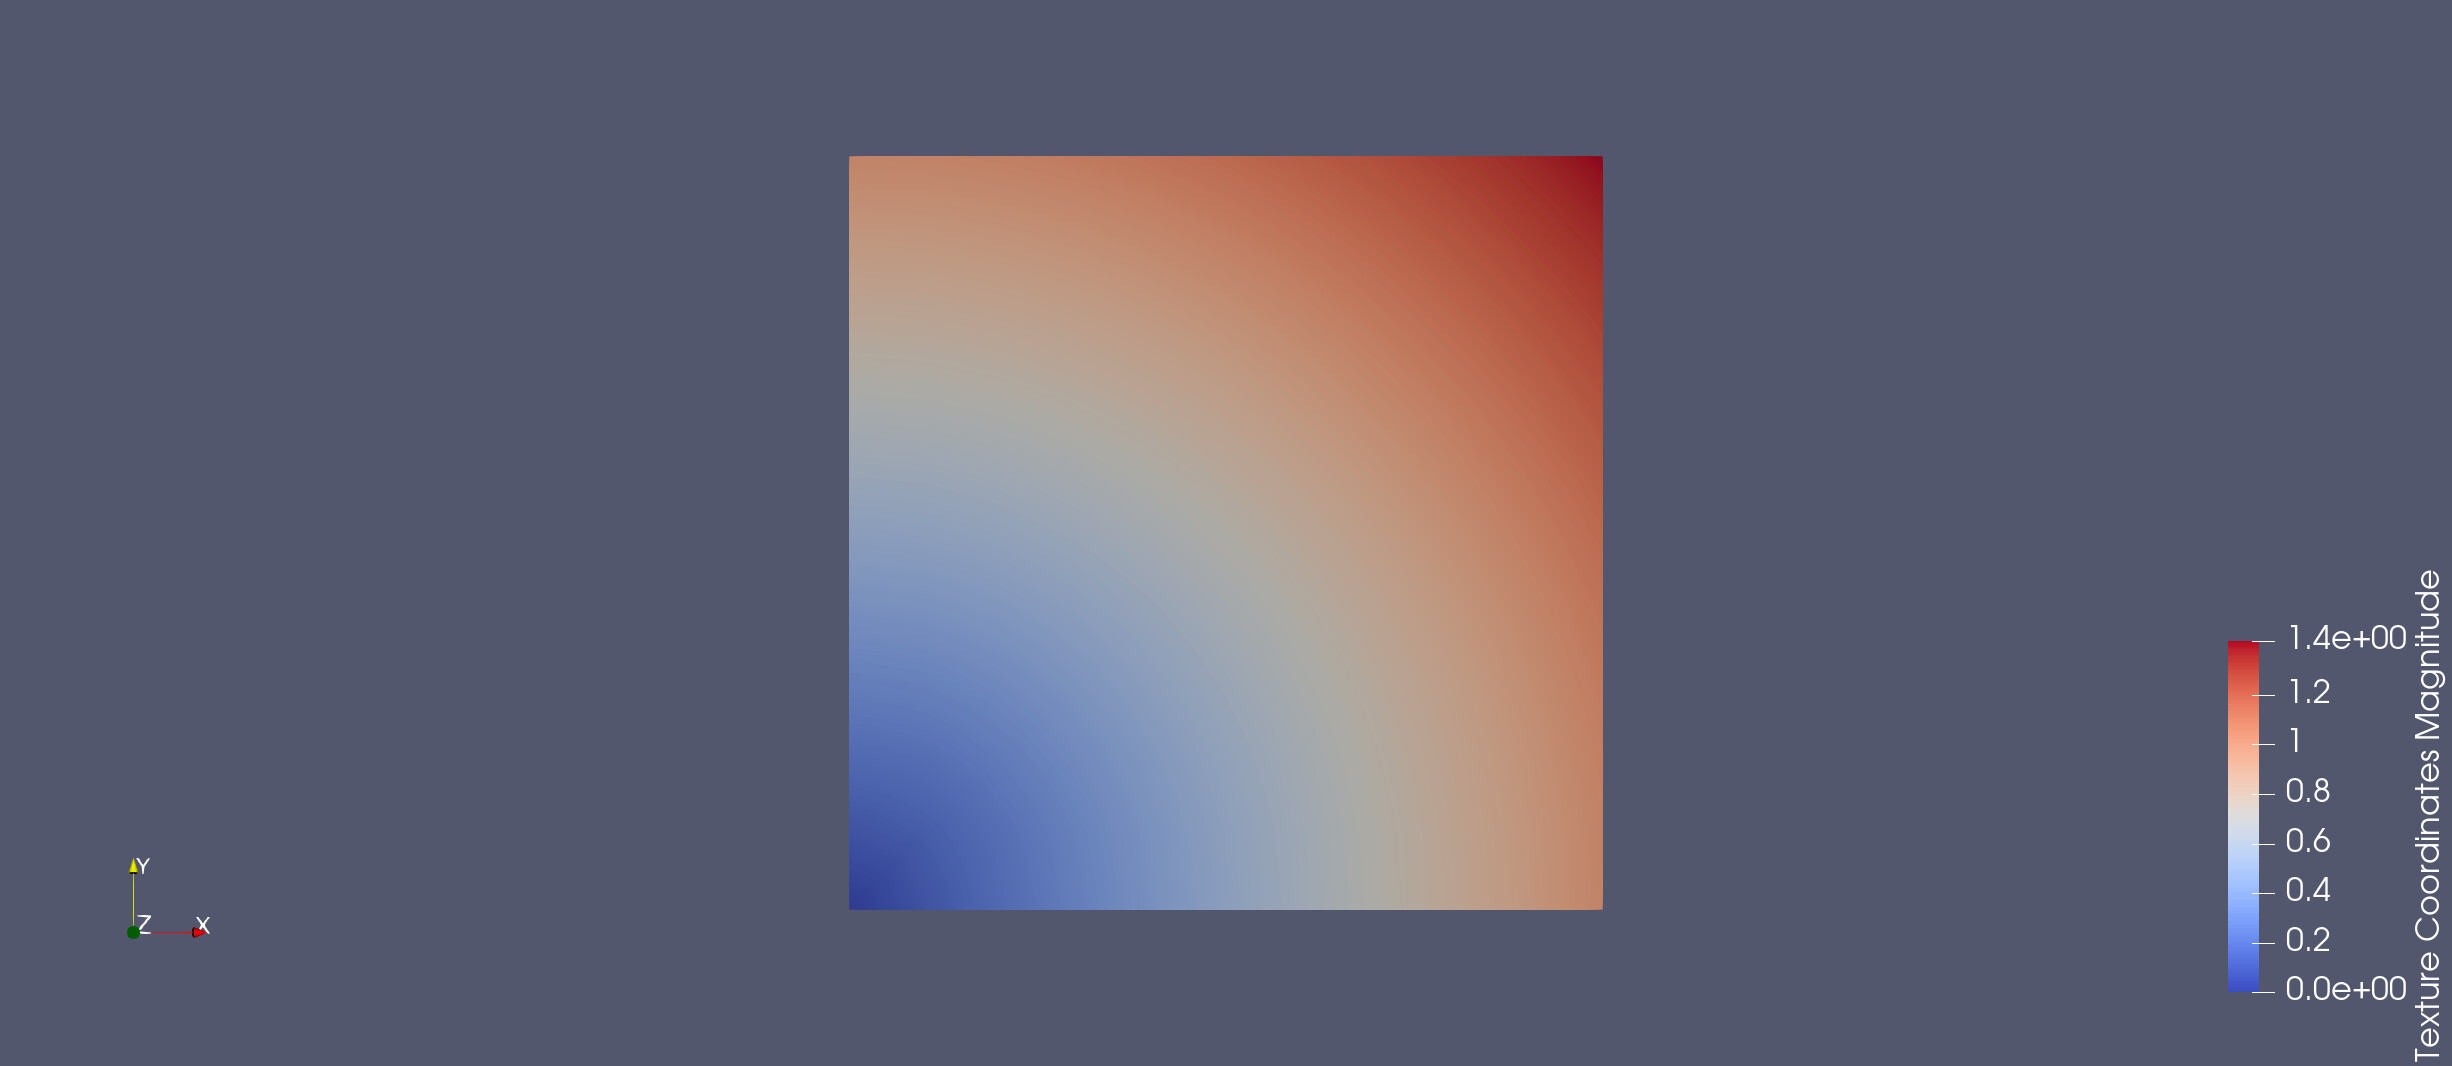
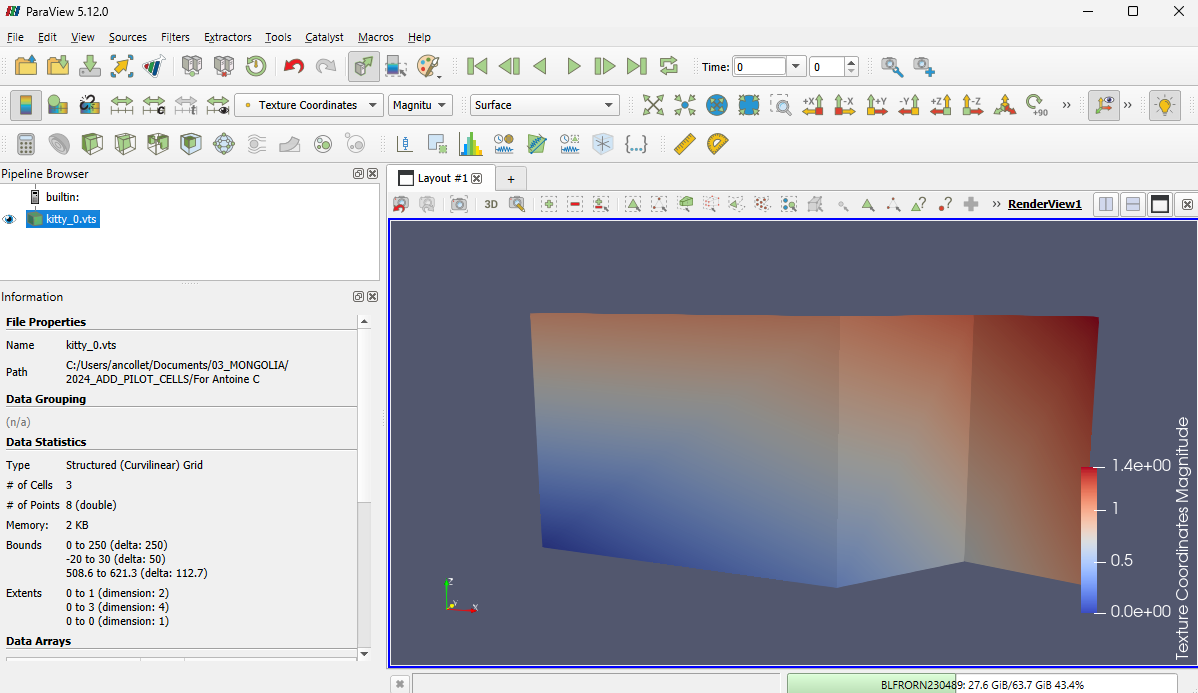
Now when I try to load the *.vts in Paraview and use the textureMaptoPlane filter, things got messed up:
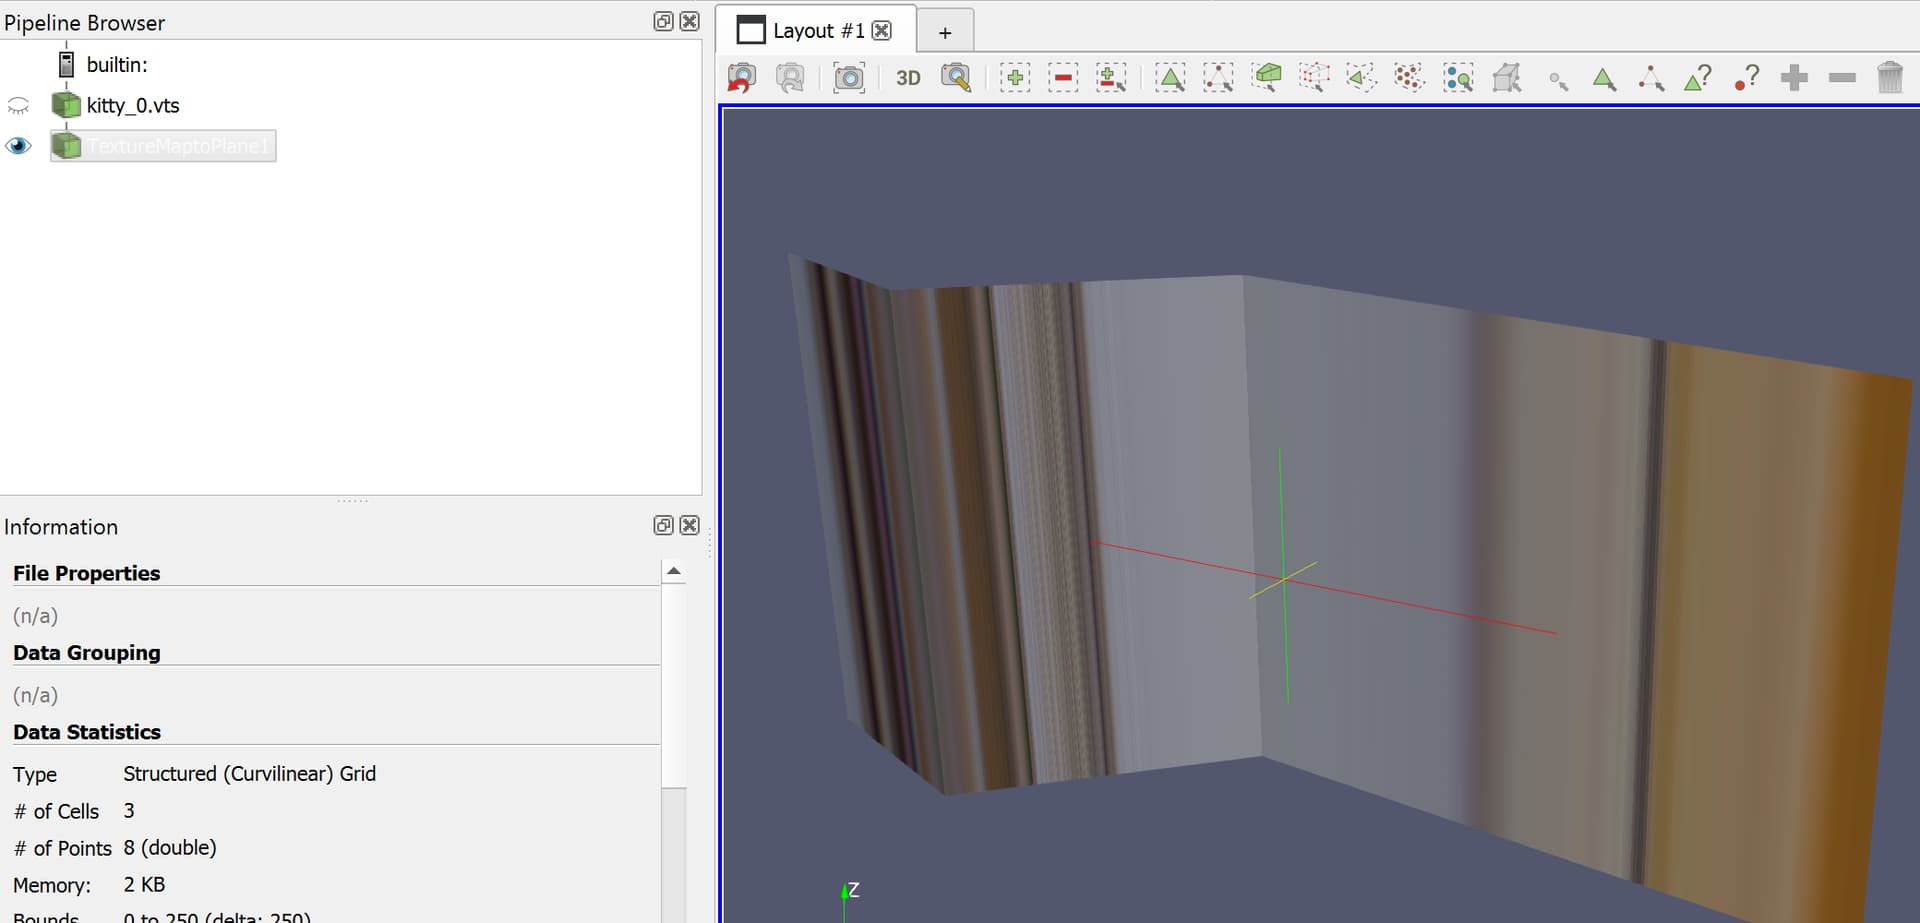
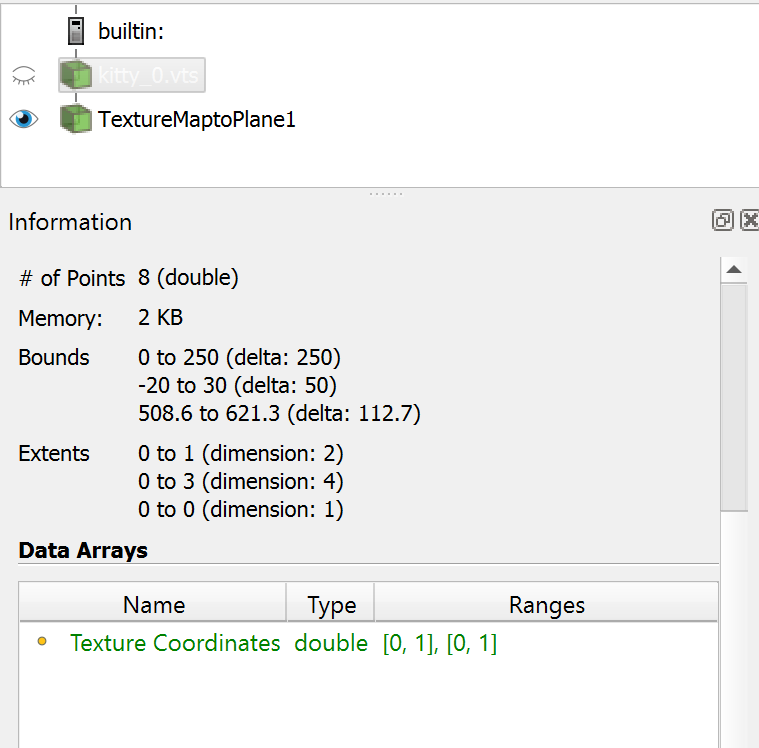
Theoretically, it should work fine because the texture coordinates are embedded in the vts…
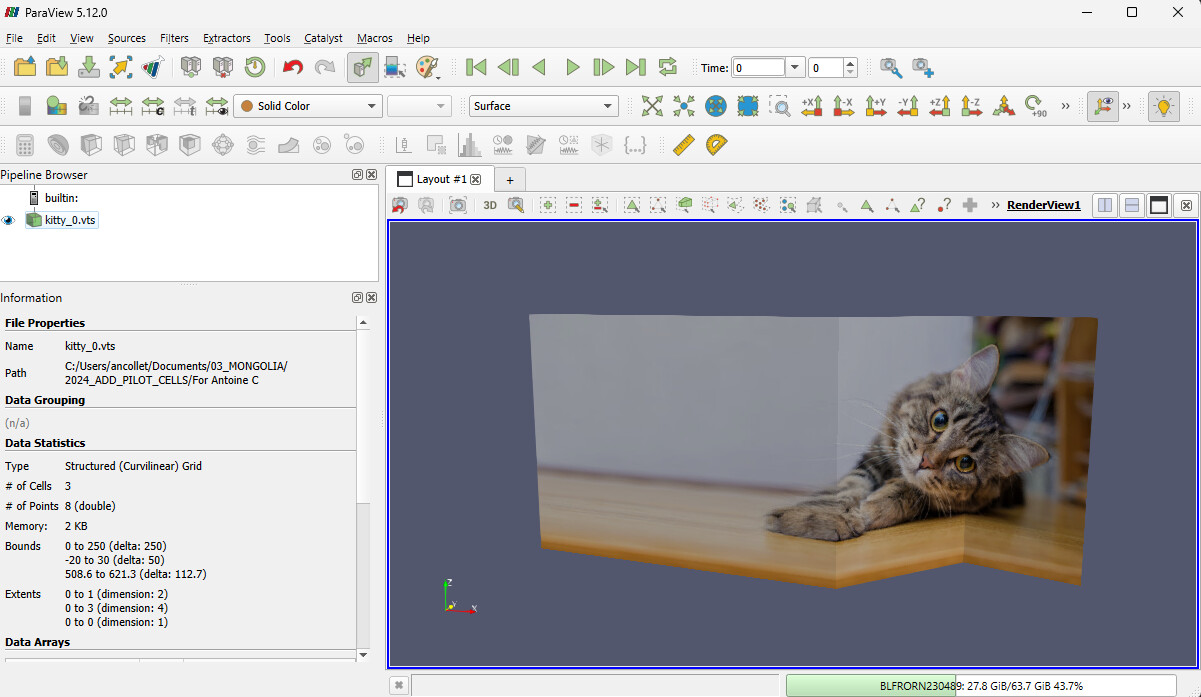
Still, it seems that I have to play with the properties:
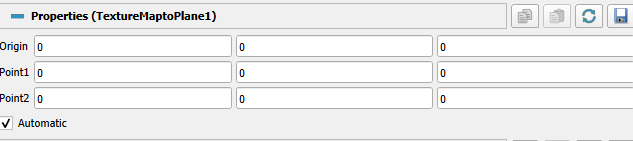
So two questions:
- Why does the “automatic” mode messes up ?
- How should I fill Point1 and Point2 in my case ?
I looked for more than one hour on the web and did not found the answer….
Thank you in advance for the help.
Antoine COLLET