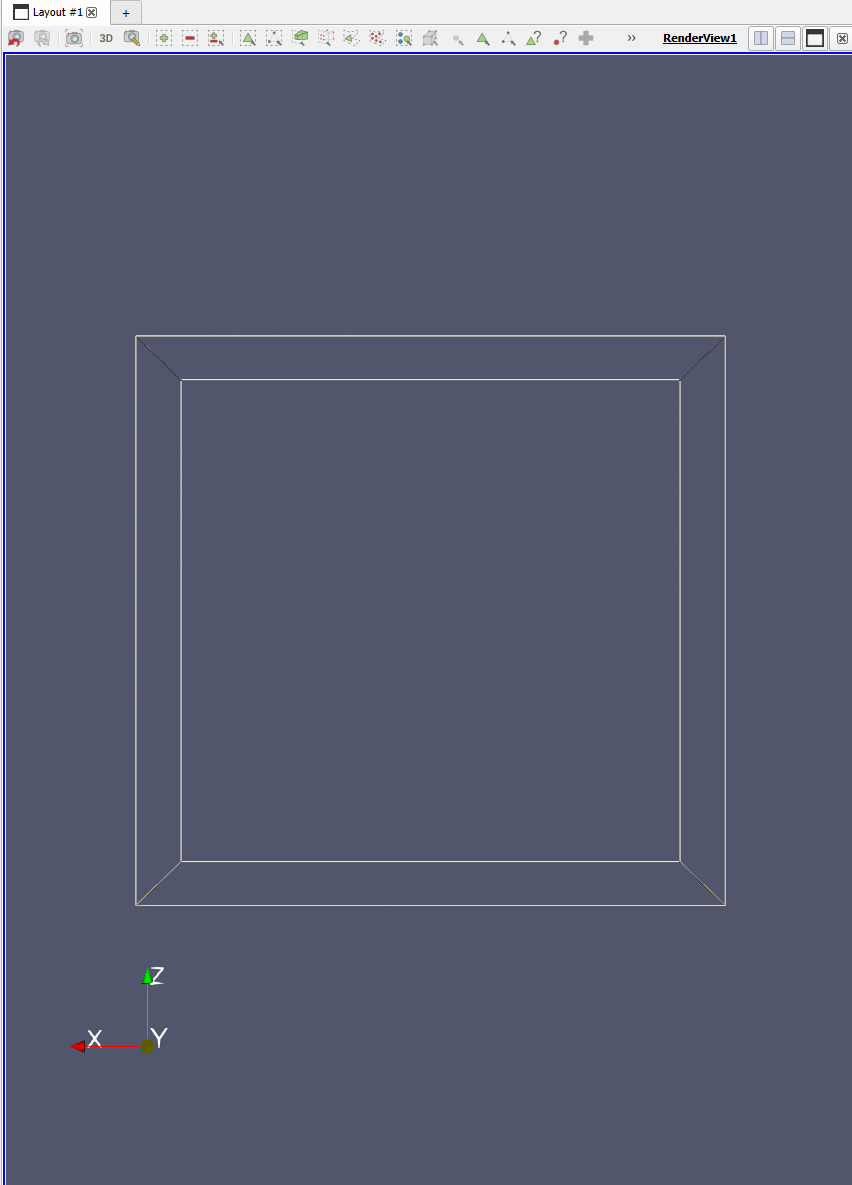
When I load my .pvti data files the default representation is Outline. I then select my data array and switch to Volume representation. The outline remains and a horizontal and vertical bar also appear. How to hide the outline and bars?

please share your data (and a statsfile) if possible.
Here is a link to the data it is > 10MB. How to generate a stats file? https://drive.google.com/file/d/1OHwkrkqLnfWcouMlz6qJM3aGIRFRb-V1/view?usp=sharing
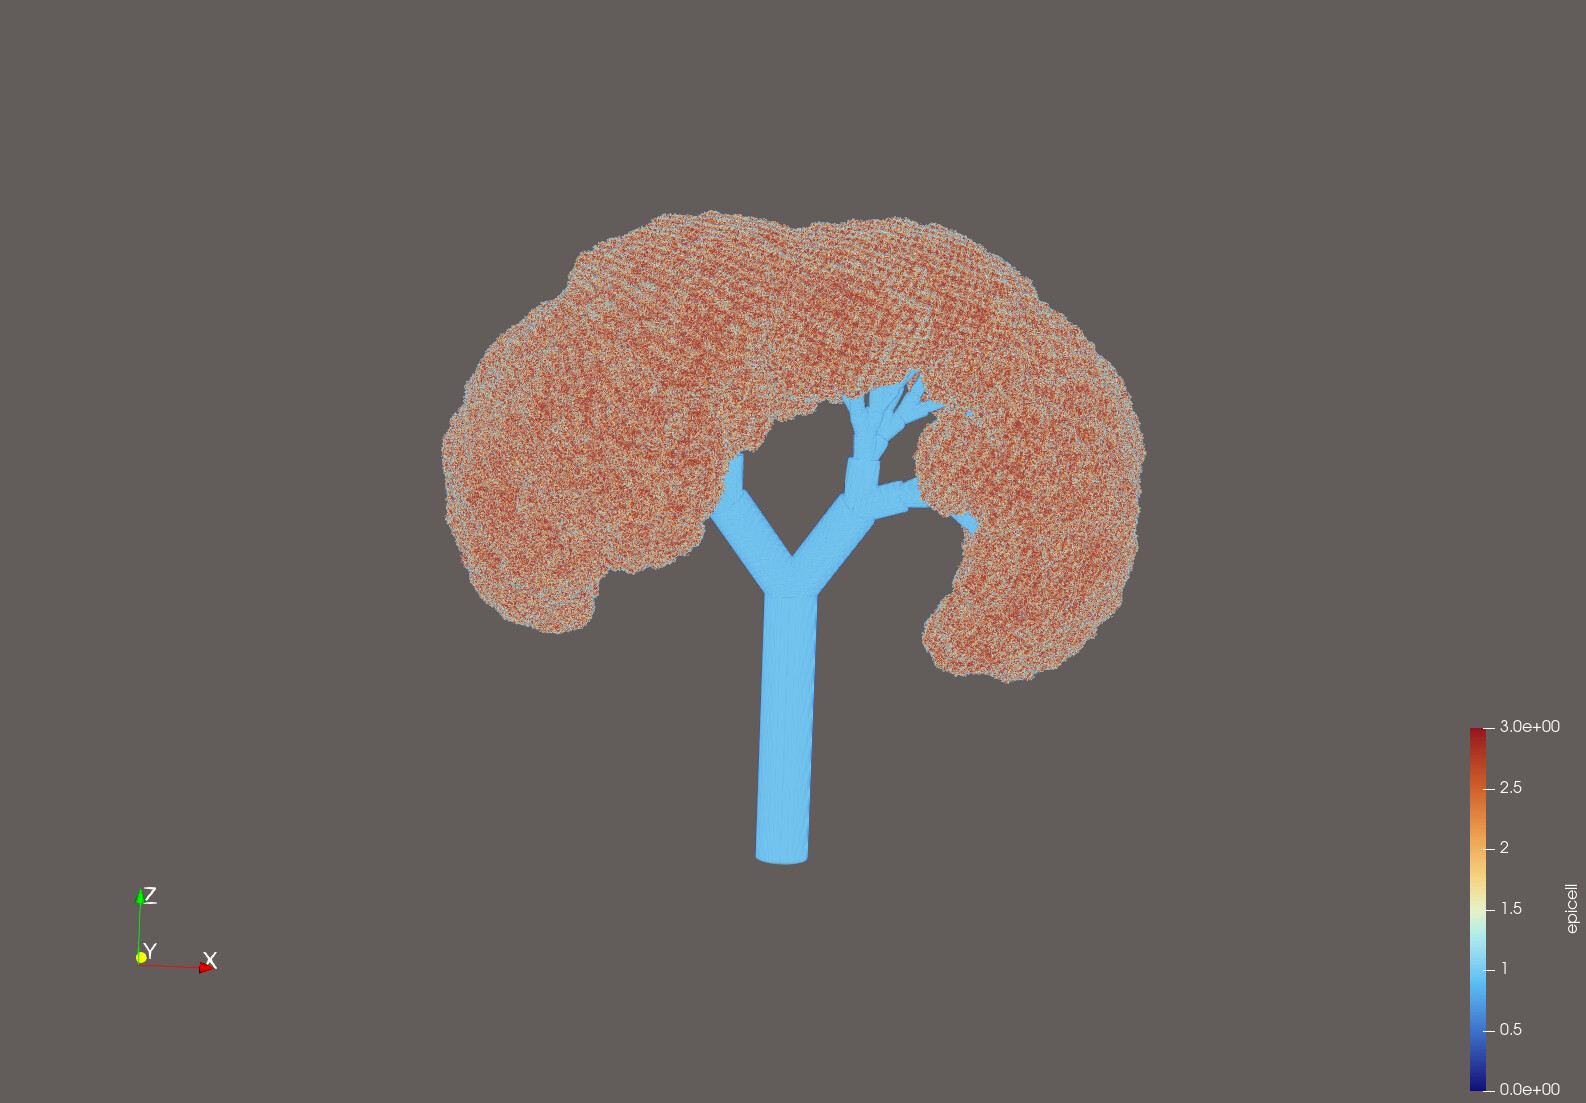
That visualization is what I am seeking. Here is the state file. I am using ParaView 5.11.1 and connecting to remote server (Rocky Linux, Intel Zeon CPU, Nvidia A100 GPUs) using ‘mpiexec -np 64 pvserver --mpi --force-offscreen-rendering --server-port=11111’ due the size of the data and client side using a Surface Book 3 laptop with Intel Graphics. Which version of ParaView did you use to display?
model.pvsm (211.6 KB)
ParaView 6.0.1 Linux Binary release.
Your state file works fine here, please update ParaView.
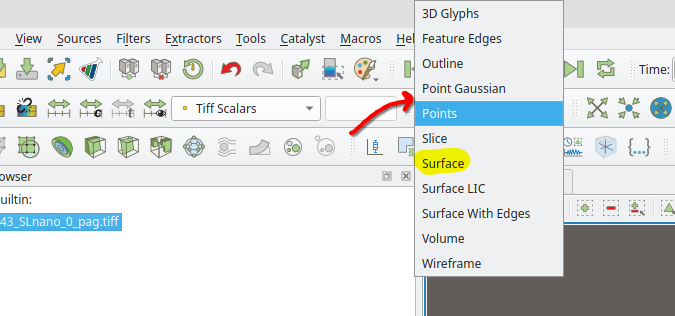
@akilandrews i think it is simply that your visual style of the filter it becomes outline and therefore you see this, try to change it to surface and maybe it solves it?
Thanks for the suggestions and sorry for the late reply. I have a ~374e6 size grid with 84% sparsity. Using version 5.11.1 the axis and bounding box appear when I expand “Display” dialog in “Properties” tab. Once the box/grid appears sometimes I cannot hide it by collapsing the “Display” dialog “-”. And when box/grid is hidden the image has a thin line down center axis than can be lessened by increasing the “Light Scale” value in the “View” dialog. Thats when I discovered how to remove box/grid completely as it is somehow tied to ray tracing. I was also able to completely toggle the appearance of the box/grid by checking/un-checking “Enable Ray Tracing” in the “View” dialog under “Ray Traced Rendering”.